I have a dashboard on Grafana that uses Elasticsearch as a datasource.
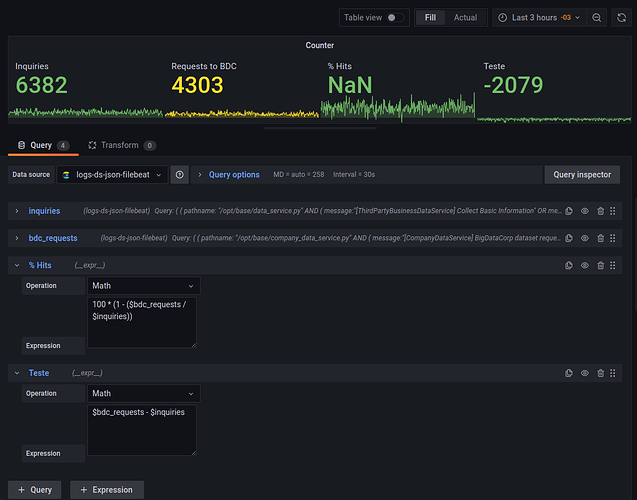
In this dashboard, I have a stat panel that displays 2 queries, inquiries and bdc_requests. The inquiries query shows the number of times the service was requested. The bdc_requests query shows the number of times the same service above had to make an external call because it couldn’t find a cache hit. Both queries return a time series.
I would like to present one more value in this panel. This new value should display the number of cache hits. This value is given by the formula 100 * (1 - (bdc_requests / inquiries)).
But the division of the time series always returns NaN, and therefore I can’t display this percentage, as you can see by the image.
Do you have any tips for me to solve my problem?
