What Grafana version and what operating system are you using?
- Version: Grafana v9.4.13 (e63c0e529c)
- OS: probably centos
What are your issues?
-
I am trying to calculate and display percentage of failure using timeseries data and Gauge dashboard
-
I’m using
Prometheusas datasource -
It seems like addition and subtraction is works like a charm, but division and multiplication between summed values are giving out wrong answers.
-
for example,
 sum(..condition) + sum(..condition)
 sum(..condition) - sum(..condition)
 sum(..condition) / 10
 sum(..condition) * 10
these calculation works fine but,
sum(..condition) / sum(..condition)
sum(..condition) * sum(..condition)
this gives out some random numbers that I don’t even know how it’s calculated.
I want to know how can I get correct calculation for division and multiplication
How are you trying to achieve it?
I’ve tried following measures
0. My Dashboard Option
- Datasource: Prometheus
- Visualization: Gauge
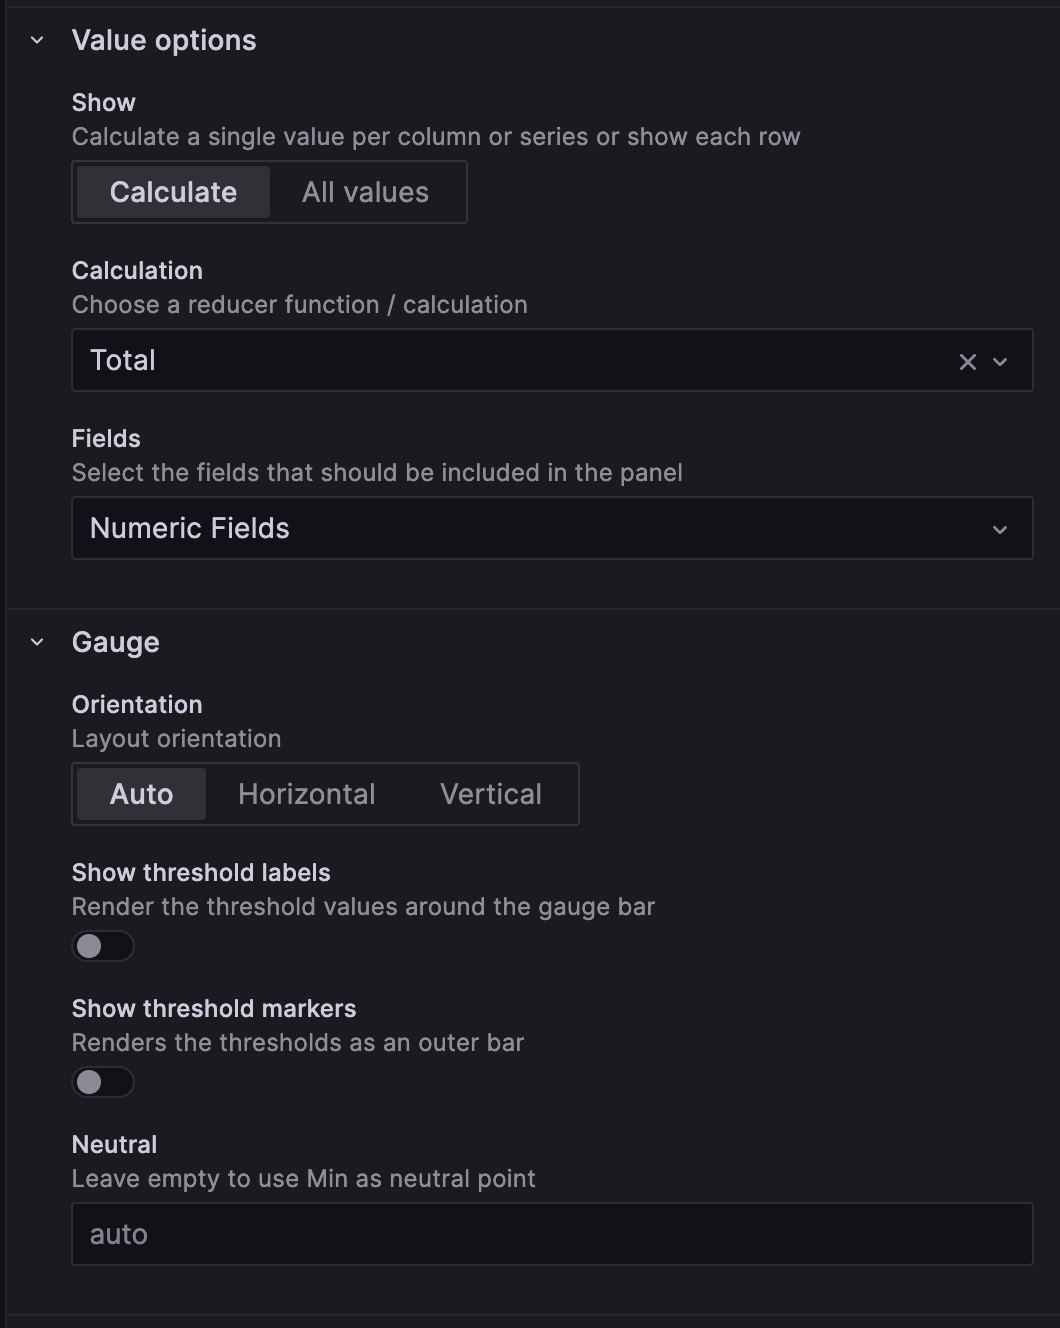
- Value options:
- Show: calculate
- Calculation: Total
- Fields: Numeric Fields
1. Using Prometheus Query (PromQL)
 sum(delta(MESSAGE_STATUS_UPDATED_total{message_status="FAILED"}[1m])) /
 sum(delta(MESSAGE_STATUS_UPDATED_total{message_status="FAILED"}[1m]))
Obviously result should be 1, but it gives me 11 instead
Also, for same time range
sum(delta(MESSAGE_STATUS_UPDATED_total{message_status="FAILED"}[1m]))
gives me 83
sum(delta(MESSAGE_STATUS_UPDATED_total{message_status="FAILED"}[1m])) * sum(delta(MESSAGE_STATUS_UPDATED_total{message_status="FAILED"}[1m]))
but this gives me 684.
sum(delta(MESSAGE_STATUS_UPDATED_total{message_status="FAILED"}[1m])) * 83
funny thing is that this gives me correct answer which is 6889.
Thanks to chatGPT I’ve already tried changing some of the functions used in query by his help
- using
rateinstead ofdelta→ still not working - using
increaseinstead ofdelta→ still not working
2. Using expression
so I’ve separated query to use Expression instead. sorry for repeating queries but I want to show exactly what I did.
# Query A (result: 83)
sum(delta(MESSAGE_STATUS_UPDATED_total{message_status="FAILED"}[1m]))

# Query B (result: 83)
sum(delta(MESSAGE_STATUS_UPDATED_total{message_status="FAILED"}[1m]))

# Expression (result: 11)
Operation: Math
Expression: $A / $B
guess what the result was still 11
3. Using transform
well so I thought maybe it’s the problem of Prometheus, and tried to use transform to use Binary Operation

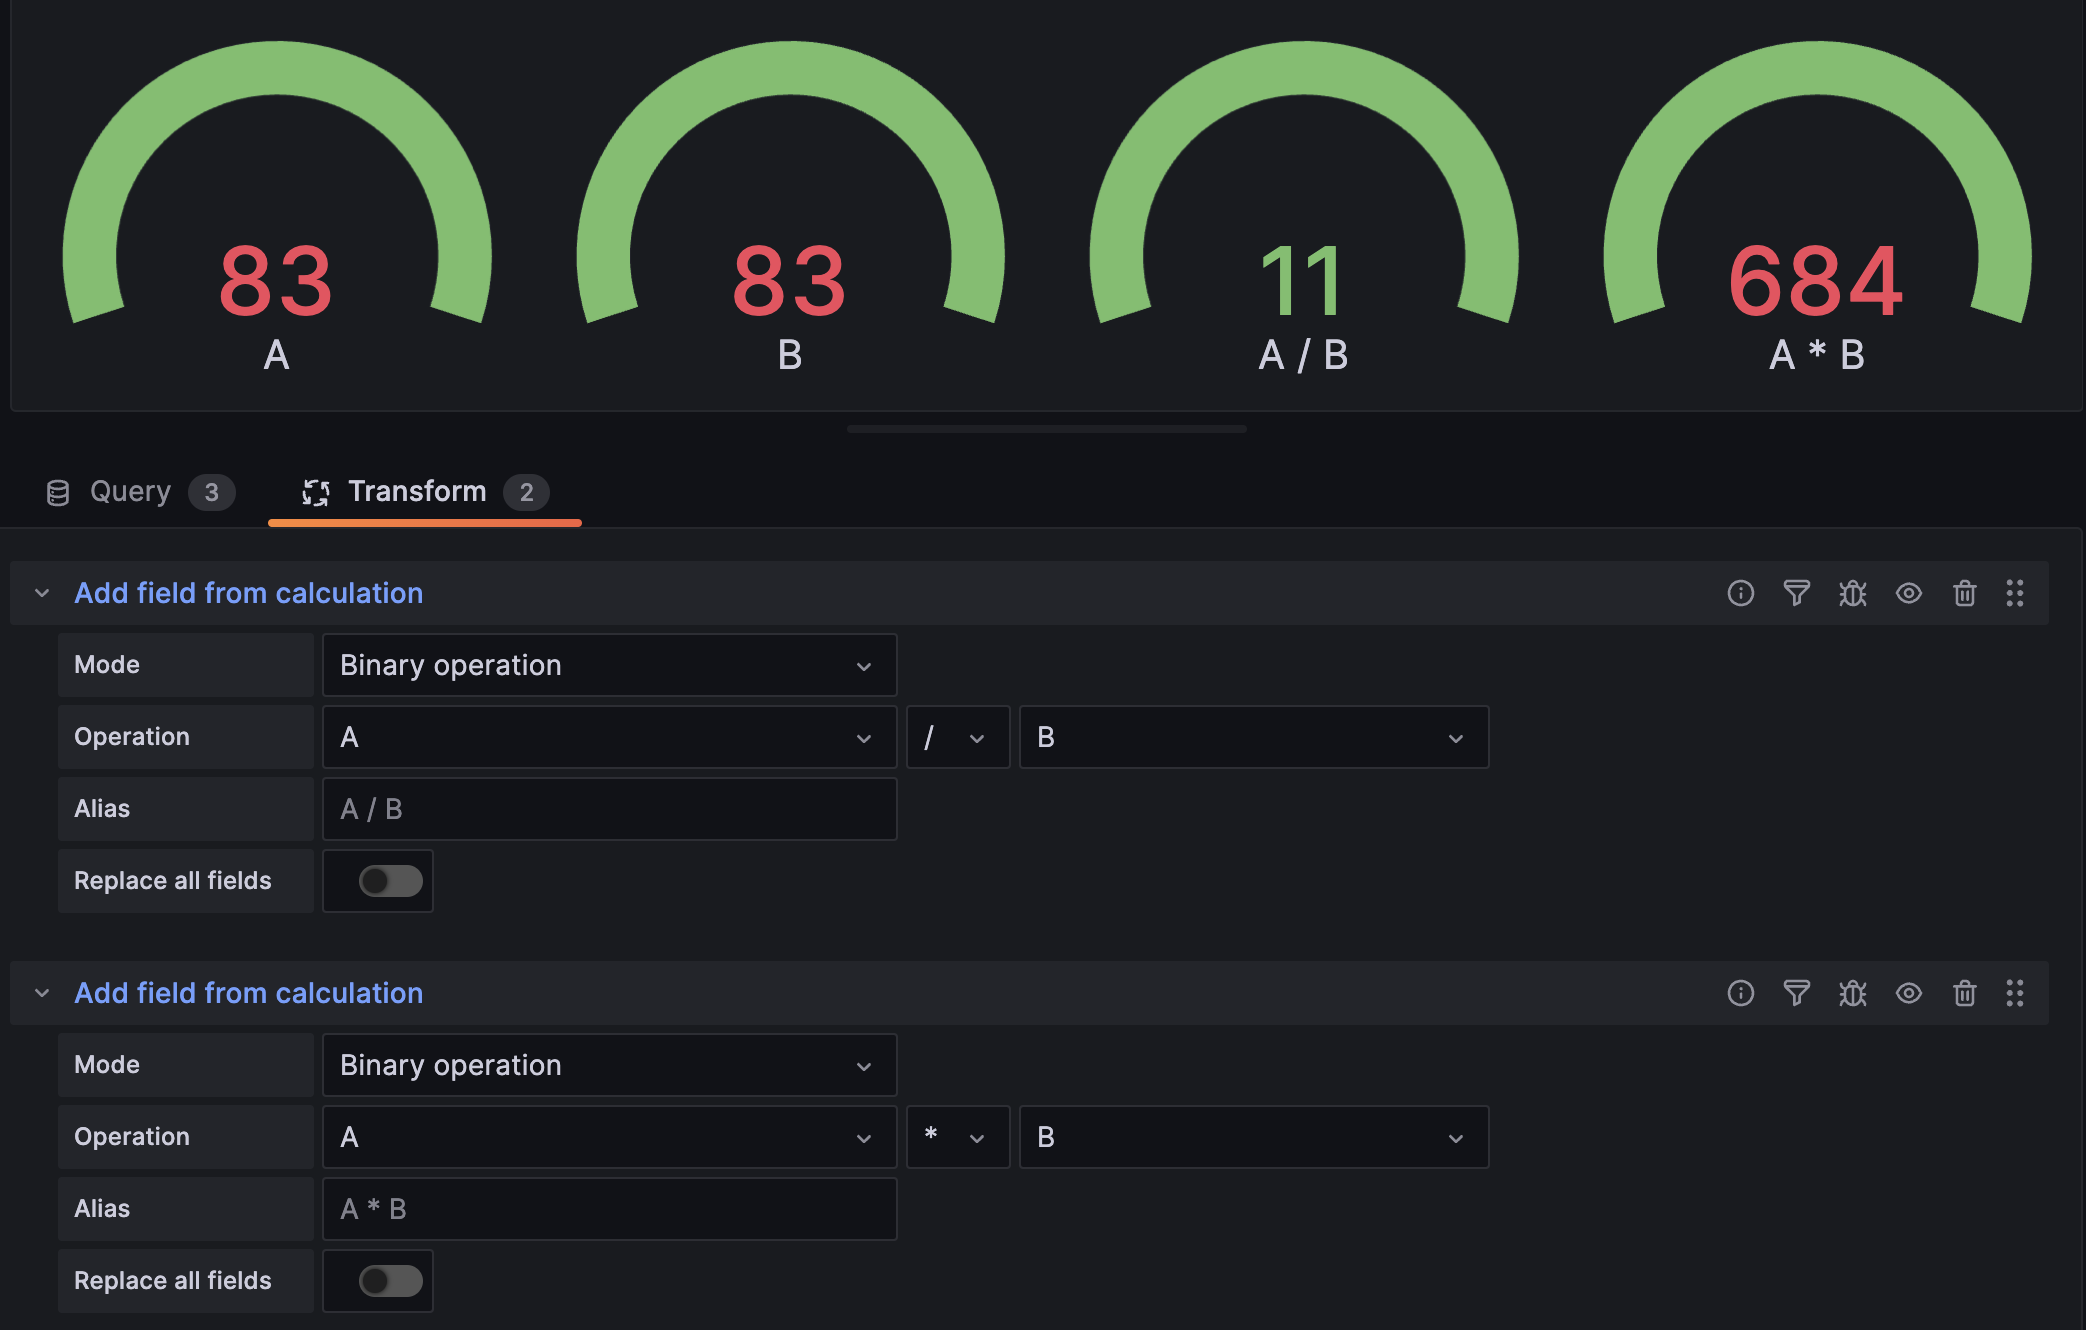
and this is the result
Now, I’m not sure what other ways I can try to get the correct division, multiplication response.
Do anyone know if there is a way to get correct division value?
Thanks in advance.