-
What Grafana version and what operating system are you using?
-
Grafana v12.1.1 (df5de8219b), running on docker
-
What are you trying to achieve?
-
I am building a finance dashboard. I want to have variables physically placed in the panel, an example below:
-
How are you trying to achieve it?
-
I do not know how to achieve this. I can create variables for the full dashboard, but these take a lot of space in the header of the page (e.g., I cannot see the actual dashboard in mobile devices - see screenshot below)
-
I may also have embedded dashboards with their own variables, but I am not sure on how to achieve this (I did not find any such panel type in visualisations)
-
What happened?
-
Not applicable
-
What did you expect to happen?
-
Not applicable
-
Can you copy/paste the configuration(s) that you are having problems with?
-
Not applicable
-
Did you follow any online instructions? If so, what is the URL?
-
Not applicable


Hi, as far as I know variables can be done only for entire dashboard. What you could do is:
- create a variable that will be used only for specific panels (e.g. var1) and hide it from user’s view (show: Nothing in settings)
- create a stat panel that will have all the options of var1
- using data links, set the variable var1 value to the clicked stat
It’s somewhat cheating but you could have something that changes the variables next to the panel. I don’t think you could do any better in vanilla Grafana.
It could look something like this:

That might work, let me try it out!
Thank you both for your help (this is an amazing community!).
@dawiddebowski - your solution works! Grafana has some limitations, for instance:
- Multiple choice: let’s say I want to see the dashboard for var1 if var1=”A”, var1=”B” or var1=”C” (e.g., I would CTRL+Click “A” “B” and “C”) - I need to click each and append to the URL in the data link. This makes unsetting a variable difficult
- The dashboard does not refresh (setting to 5s refresh helps, but 5s is still not immediately responsive)
@yosiasz - I don’t think I have this feature enabled. I can’t find the .ini files on my docker configs folder (as suggested on Configure feature toggles | Grafana documentation). The answer may be in my “docker run “ command. Could you provide any guidance?
Cheers,
I am not sure which one of these does it but here it is.
[feature_toggles]
enable=dashboardNewLayouts,kubernetesDashboards,dashboardScene,sqlExpressions
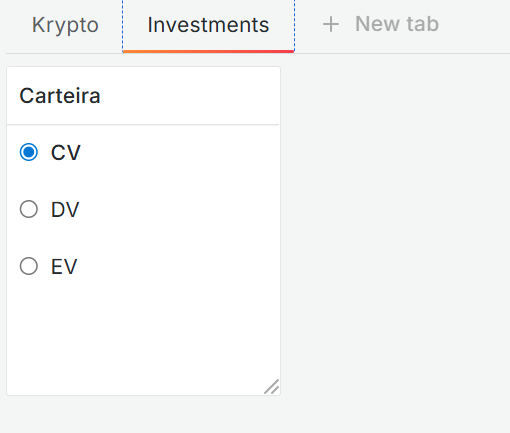
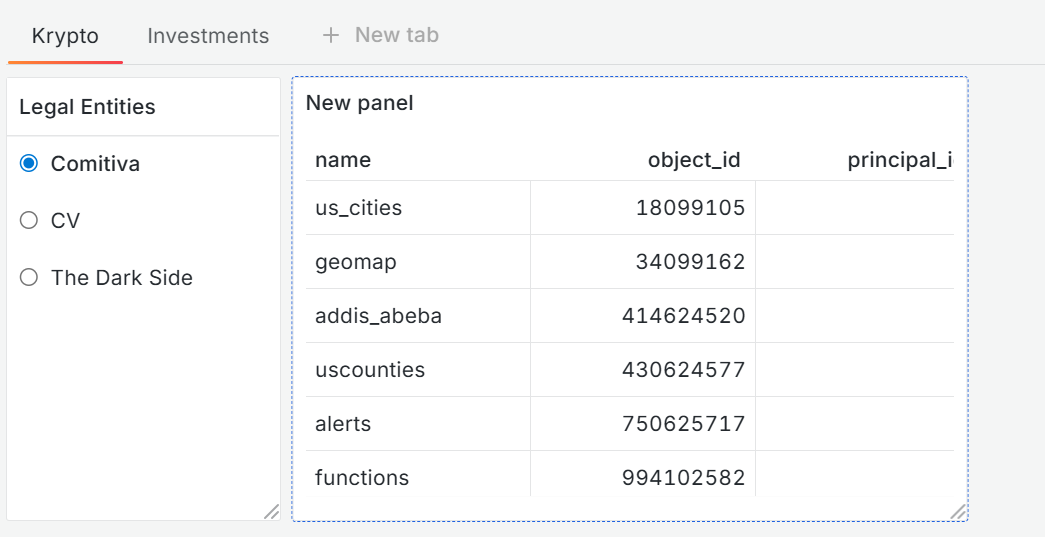
Thanks @yosiasz - I am running the new version and have the tabs!
How are you able to have different variables per tab (in the example you made: K*pto has “Legal Entities”, Investments has “Carteira”)?
using this plugin
Thanks, I’ll try it out
Works a charm! Thanks!
@vascodorey so how does it look like with tabs and all on mobile?
Looks beautiful! I need to tweak it, though (e.g., variables are displayed first - is there a way to make the business variables panel adjust its size according to the number of variables that exist?). I am still on the process of hiding variables, but I think I’ll manage it.
Cheers and have a nice weekend!
show us the results when done please. solution was shared with you, so sharing the final result will help others.
@yosiasz - it’s still a bit work in progress (I am intending to explore these volkov labs plugins to more extent), but here you go:
Here’s the desktop version:

Here is the mobile version:

Once again, thanks for your help!