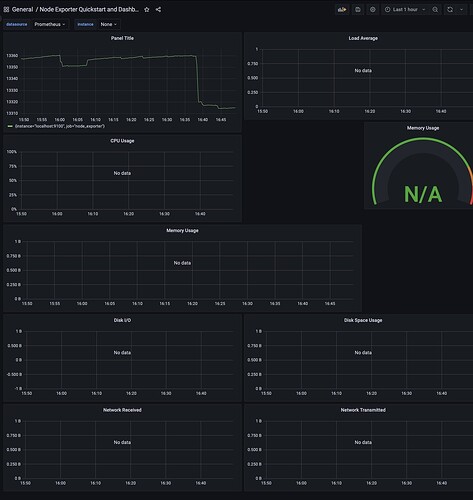
I’m a complete newb. I believe I’ve installed Prometheus and Grafana correctly (services are running and are reachable, Prometheus data source as been added—though I’ve had plenty of issues with that …).
I can manually create a simple dashboard panel with a PromQL query but if I import any preconfigured dashboards (using that source) no data is available.
welcome to the  community forum @dean3e46
We are excited that you joined our OSS community. Please read about some of the FAQs in the community 
Please review the submission template and include more details:
-
What Grafana version and what operating system are you using?
-
Are you importing a dashboard from this page? if, so which one?
-
Getting any errors? Try increasing the verbosity of the Grafana server logs to debug and note any errors.
-
Did you follow any online instructions for installing Grafana / Prometheus? If so, what is the URL?
I am using the current version of Ubuntu 22.04. Grafana 9.3.6
I’ve imported many node-exporter dashboards. The problem seems consistent.
I’m not seeing any log errors but I could be doing it wrong LOL. I am using the log viewer.
I used a couple places for instructions. Main one here: https://www.digitalocean.com/community/tutorials/how-to-install-prometheus-on-ubuntu-16-04
I used the official install guide for Grafana: https://grafana.com/docs/grafana/latest/setup-grafana/installation/debian/
Hi @dean3e46,
Can you please share with us picture of one query from imported dashboard? I suspect that all those queries are mapped to data source which name differs from name of you data source.
For example I named my Prometheus data source “Prometheus123” and if queries in imported dashboard are mapped to different name (e.g. Prometheus) then queries won’t work:
Also please check if with imported dashboard you also got dashboard variable which define datasource (if that’s true then in query you would see something like ${variablename}:
Dashboard settings (cog icon in upper right corner) -> Variables
Maybe there is filter applied under “Instance name filter” field.
Best regards,
ldrascic
Many of the imports do ask for a datasource when importing (I’m thinking older ones didn’t?). There was only one imported dashboard where one of the variables was ‘datasource’ and is was set to the only source I had, Prometheus, and there were no filters applied.
Here’s a screenshot of a dashboard that was imported where everything is empty but I can add a panel with a simple query (node_memory_MemAvailable/1024/1024) which does display data


