Grafana dashboard doesn't load data source though the data source is working by testing

Grafana dashboard doesn’t load data source though the data source is working by testing.

The detail is described like the below.

1. Add and test data source

enter image description hereenter image description hereenter image description here


2. Import dashboard

  • Import Json file is here
    enter image description here

3. The dashboard doesn’t load the data source

enter image description here


I am running Prometheus and Grafana on docker-swarm.

  • Ubuntu16.04
  • Docker 17.09.0 ce
  • Prometheus 2.0.0 (prom/prometheus)
  • Grafana 4.6.2 (grafana/grafana)

You should not add the node exporter but the prometheus server. Sure you have the right port to prometheus?

What do you mean I should not use node-exporter?

  • node-exporter is Prometheus exporter for machine metrics, I run it with Docker as well.
  • The Docker image is here

I am sure I am using the port for the endpoint(node-exporter).

  • Save & Test is saying Data source is working meaning I am using the right port.
  • You can see Prometheus target node-exporter is up on the port in the second screenshot.

Node exporter is the collector, the address you specify in grafana should be prometheus (usually port 9090 i think)

Sorry, I am very new at Grafana and Prometheus .

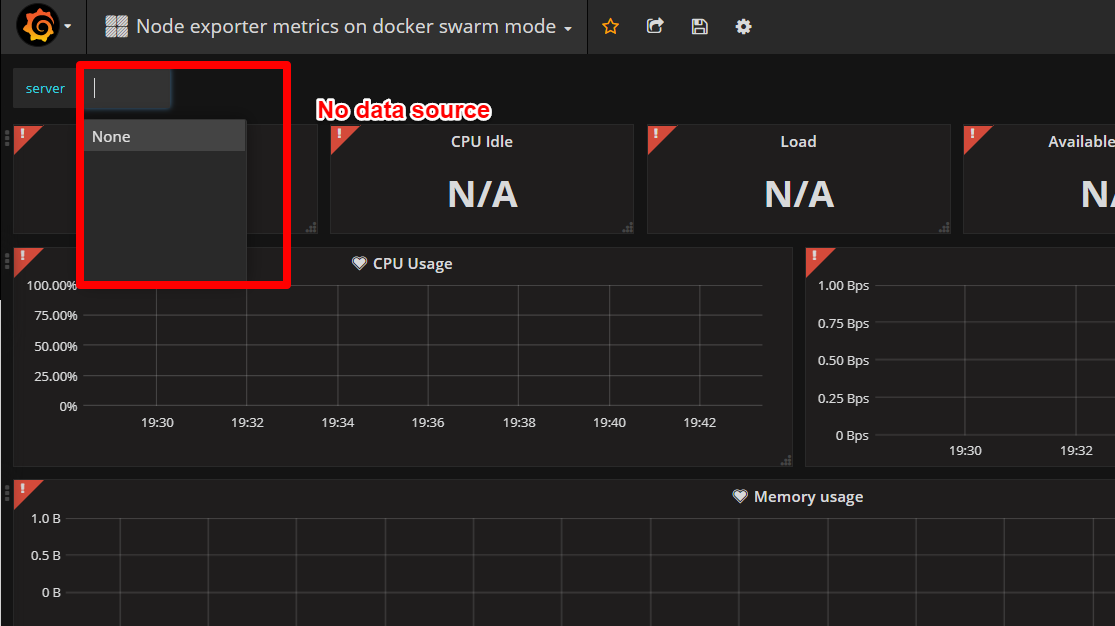
As my understanding, Prometheus use pull method to collect metrics from Prometheus exporter and I assume that Grafana also just can pull the Prometheus exporter itself by registering Prometheus type data source the same as Prometheus Server.

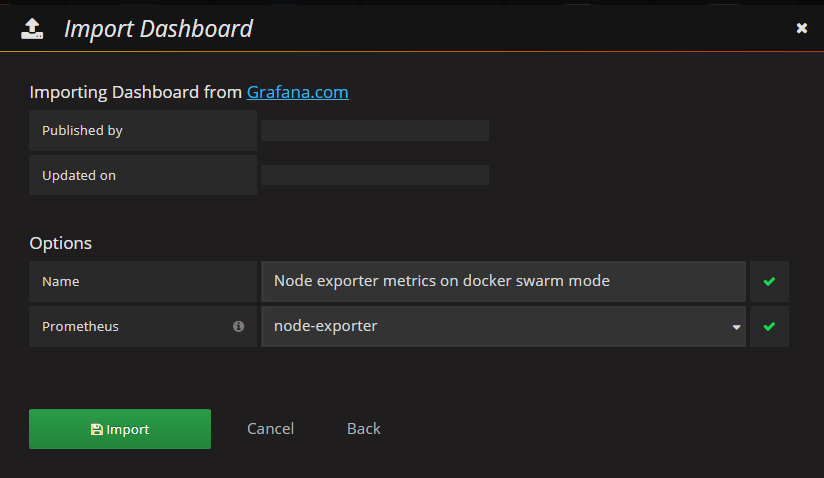
However, you seem to be saying that I should set data source URL as Prometheus Server itself.
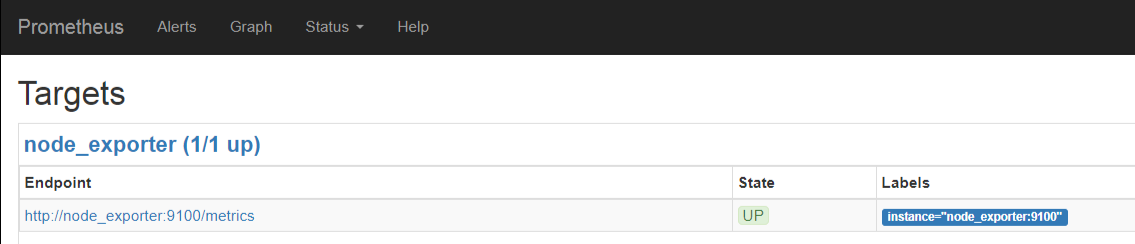
I did try but It seems to scrape only prometheus(localhost:9090) endpoint metrics but node_exporter(node_exporter:9100) endpoint (Please refer the below Prometheus config), is it right?

global:
    scrape_interval: 5s
    external_labels:
        monitor: 'my_monitor'

scrape_configs:
    - job_name: 'prometheus'
      static_configs:
          - targets: ['localhost:9090']

    - job_name: 'node_exporter'
      static_configs:
          - targets: ['node_exporter:9100']