We’ve been running Grafana for weeks with some InfluxDB databases that are being updated about once a second. The Grafana version is v5.4.3 (6539180).
Yesterday we started seeing issues with the graphs where several minutes of data was being cut off from the left side of graphs. This prevents the “Last 5 minutes” range from even showing any data at all.
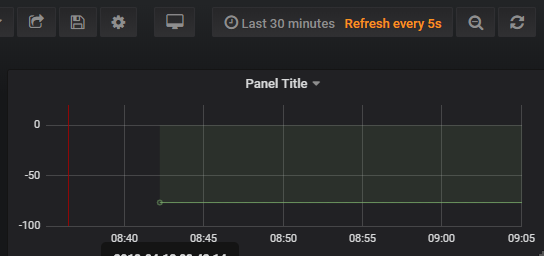
The screen shots below show the same data at 15 minute and 30 minute ranges.
This behavior is seen in multiple dashboards using multiple InfluxDB databases.
The data is there – by varying the time ranges you can see all the data, but a few minutes are always cut off on the left side. I’ve also used queries and graphs in Chronograf to confirm that the data is definitely there.
I have tried restarting the Grafana service and even restarting the whole server.
Is this a Grafana bug or a global setting we’ve somehow changed?
Update: I’ve upgraded to V6.1.3 and I’m still seeing the same behaviour
[Edit] I know you said you have proved by other means that there is data there, but by hovering over you will see whether the query you have used is returning any.
Hovering anywhere in the blank region shows the value and time of the first visible sample.
In the example below all cursor positions before 8:45:52 show the time and value for the sample at 8:45:52
That isn’t actually what I asked, I asked about 08:55. However, I suspect that will also show that the last sample before 08:55 is at 08:45, which means that your query is not returning any samples for the periods that are shown blank. In which case either the data is not being written every second, or something about your query is not fetching them all.
Here’s a much better example showing the issue, with varying data and data points shown
I’ve added a table showing the same value as the graph.
The screen shot below was taken after a refresh at 10:57:53
Note that the table shows the latest value but the latest value on the graph is from about 10:50
The graph seems to be fetching the values for 15min from 10:43 to 10:58 but displaying the period 10:35 to 10:50. As a result, there are no values to show before 10:43
We’ve made an observation the may help solve this issue.
The time on my Windows desktop is locked by policy to our company server time, which for some reason is currently running slow by 8 minutes.
My server running InfluxDB and Grafana has the correct time set.
It looks like the graph does the query based on server time, and renders it based on the desktop time.
The time at the right end graph matches the desktop time exactly when you do a refresh.
The time in the database should be in UTC, so the time zone of the server should be immaterial. It is difficult to see what else the browser code can do other than assume that the clock on the PC is correct for the user, so when you ask for data for, say, 10:00 it works out what that is in UTC and gets the data for that timestamp from the DB. What else could it do?
From the examples I included:
The query appears to get the last 15 minutes based on the database server time, not the browser time.
(This can be seen in the table panel that has samples from 8 minutes ahead of the browser time)
The graph then renders the period spanning the last 15 minutes based on the browser time.
It seems it would be less confusing to either:
A) Query for the period from (browser time (UTC) - 15mins) to (browser time (UTC))
If the browser time is running fast, data will be missing on the right side of the graph.
This at least makes more sense than missing data on the left side (if the browser is running slow).
- or -
B) query for the last 15mins from the database and graph using the returned time stamps in the data
There may be technical reasons preventing these options, but either would seem less confusing than the current behavior.