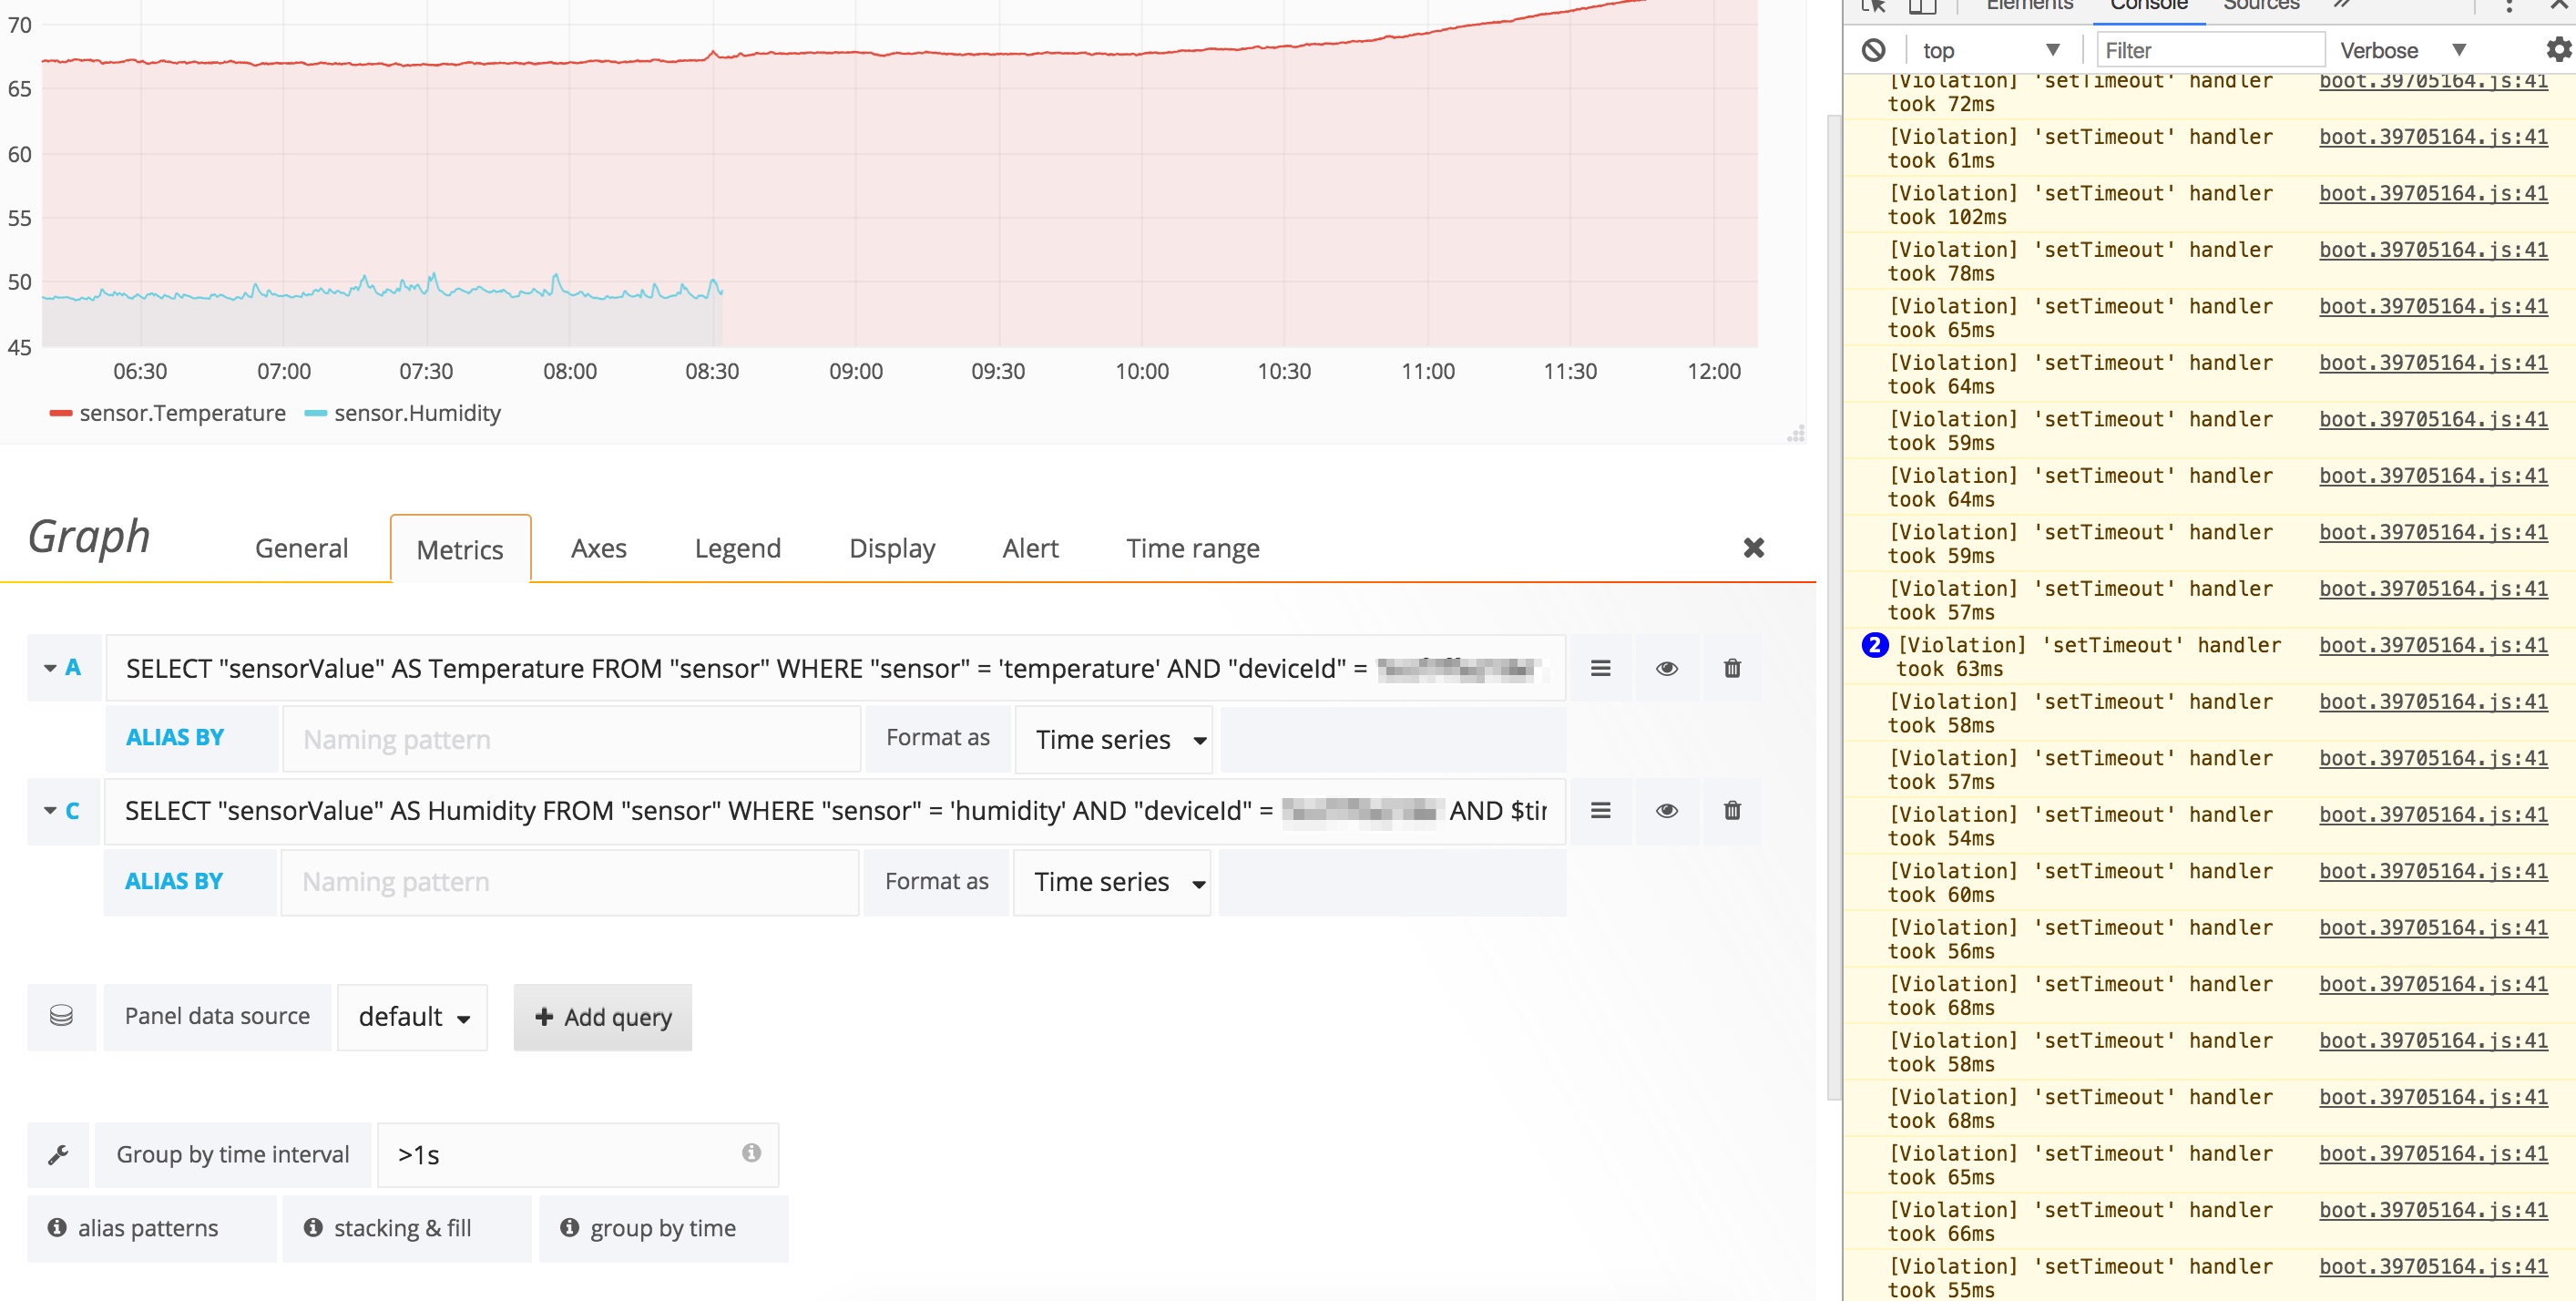
I have a dashboard with Temperature and Humidity graphs. The data renders for a 3Hr period but when I zoom out to 6Hr the line breaks as if the data for that period (3Hr - now) is missing. The data is obviously there since it shows up in 3Hr. graph. This happens in every graph. What am I missing?
Here’re the queries, and response. The array is rather large to post here but it does say partial in the end so may be it truncating the data? How does one fix that?
The max-row-limit was set to 10K, changing it solved the problem. I guess I need to revisit my queries to fetch less data.
Thanks for your quick response and help.