What happened: We have grafana setup for a client of ours and when I open a dashboard and try to get information that its querying, it doesn’t load up that information for me. But when I go to a time frame that we know there was a recent event going on and we should see some data nothing shows up. But going back past a month or so its able to retrieve it if that makes sense. Also for the particular panes that Im looking at the queries are correct because it works for another client of ours.
What you expected to happen: In theory it suppose to show us data of different systems we are querying via snmp at which ever time frame we choose.
How to reproduce it (as minimally and precisely as possible): In regards, to this I don’t know.
Anything else we need to know?:
Environment: The Grafana service is hosted in a Virtual Machine that runs Ubuntu 64 bit with 4 GB memory and 250 GB of storage
Grafana version: 9.0.6
Data source type & version: Influx DB and shell version is 1.7.8.
OS Grafana is installed on: Ubuntu (64 bit)
User OS & Browser: (OS: Windows 10) (Browser: Edge)
it doesn’t load up that information for me. But when I go to a time frame that we know there was a recent event going on and we should see some data nothing shows up.
For a time interval that does work, can you click on Table view and see data?
For a time interval that does NOT work, can you click on Table view and see data?
It would appear you are using an old version of Influx and likely InfluxQL. At what time interval are you recording the data (once a second? twice a minute? 15 times per hour?, etc.)
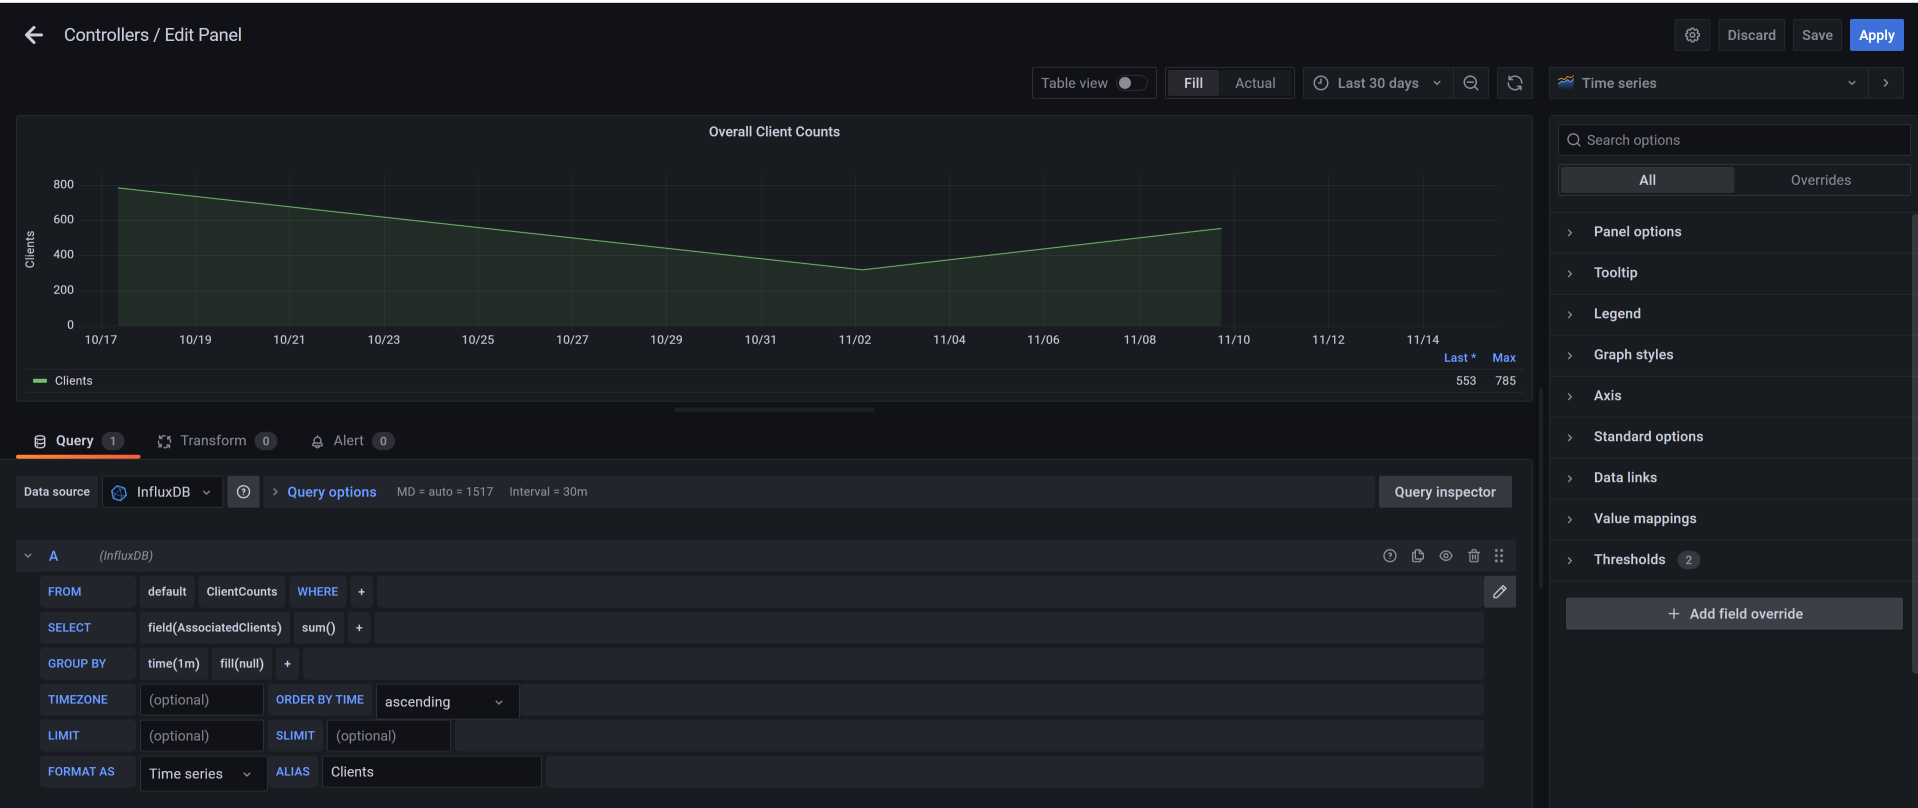
But for the time frame specified as of last 7 days or sooner no data shows up but I do get the information as of Last Highest Count and The max count for that time period. So I see data for the counts but not being processed on the graph.
So I changed it to Group By Time(5 min) and then the pulling interval changed to 30 min. Is that suppose to happen? Also no data showed up on the graph. It looks like from 30 days and above data shows but once I hit 7 days and more current nothing shows.
Hi Grant,
I was able to pin point what were the issues that caused this. We have scripts to pull certain information so that information can then be sent to the influxdb and process it. The script were failing and causing a hold up in querying the information from grafana. So what I did were checked all my telegraf config files and any python scripts that worked along side with the TIG Stack. Once everything was checked and fixed if needed, everything work smoothly. Thank you for your help.