Grafana "No Data" -- sometimes

I am rather newish to Grafana and especially new to trying to troubleshoot it.

There are 16 graphs on the one dashboard. I have a dataset that I am pulling from Home Assistant that has collated around 6-7 months of data, every minute. When I show the data at small time frames everything seems to come up without any issues.

If I try and pull the last year’s worth of data into the graphs, only some of the 16 shows up during most calls of a refresh. Yet sometimes, everything displays as expected, although this is the exception and not the rule. And there seems to be no rhyme or reason as to which one will display “no data” and which ones work.

Generally my calls are as follows:

from(bucket: "hacore")
  |> range(start: v.timeRangeStart, stop: v.timeRangeStop)
  |> filter(fn: (r) => r["friendly_name"] == "Cryptoinfo bitcoin usd")
  |> filter(fn: (r) => r["_field"] == "value")
  |> filter(fn: (r) => r["entity_id"] == "cryptoinfo_bitcoin_usd")
  |> map(fn: (r) => ({_value: r._value, _time: r._time, _field: "Bitcoin USD"}))
  |> aggregateWindow(every: v.windowPeriod, fn: last, createEmpty: false)
  |> yield(name: "last")

Data is pulled from an InfluxDB database.

Hi @nat5

  1. Is InfluxDB and Grafana on the same computer?
  2. Do the same queries / graphs (with last year’s data) when viewed through Influx Data Explorer (your_ip_addr:8086) come up quickly? (they should)

Perhaps your query should have a filter by measurement name, e.g.
|> filter(fn: (r) => r["_measurement"] == "your_measurment_name_here")

1 Like

InfluxDB is running on a Synology NAS running Docker and Grafana is running inside of Home Assistant

I don’t know how to create a date range in the Influx Explorer, so I don’t know how to test it using the code above.

If I use the _measurement line I seem to lose quite a bit of the data, however:

Can you access Influx Data Explorer at all? That is where you can build the Flux queries via the gui. It looks like this:


(note the date range is done using a drop down selector, just like in Grafana)

How many measurements do you have? Without that filter, the query is being forced to scan through all of your measurements.

I can get the data, I didn’t see that drop-down box selector before. I run Graphana on the tablet and then do the search on InfluxDB itself and it works on Influx every time

The InfluxDB is running on a Synology NAS Docker instance… and HomeAssistant is running on a RPi 4. It is connected to the same network switch with connected FE between them.

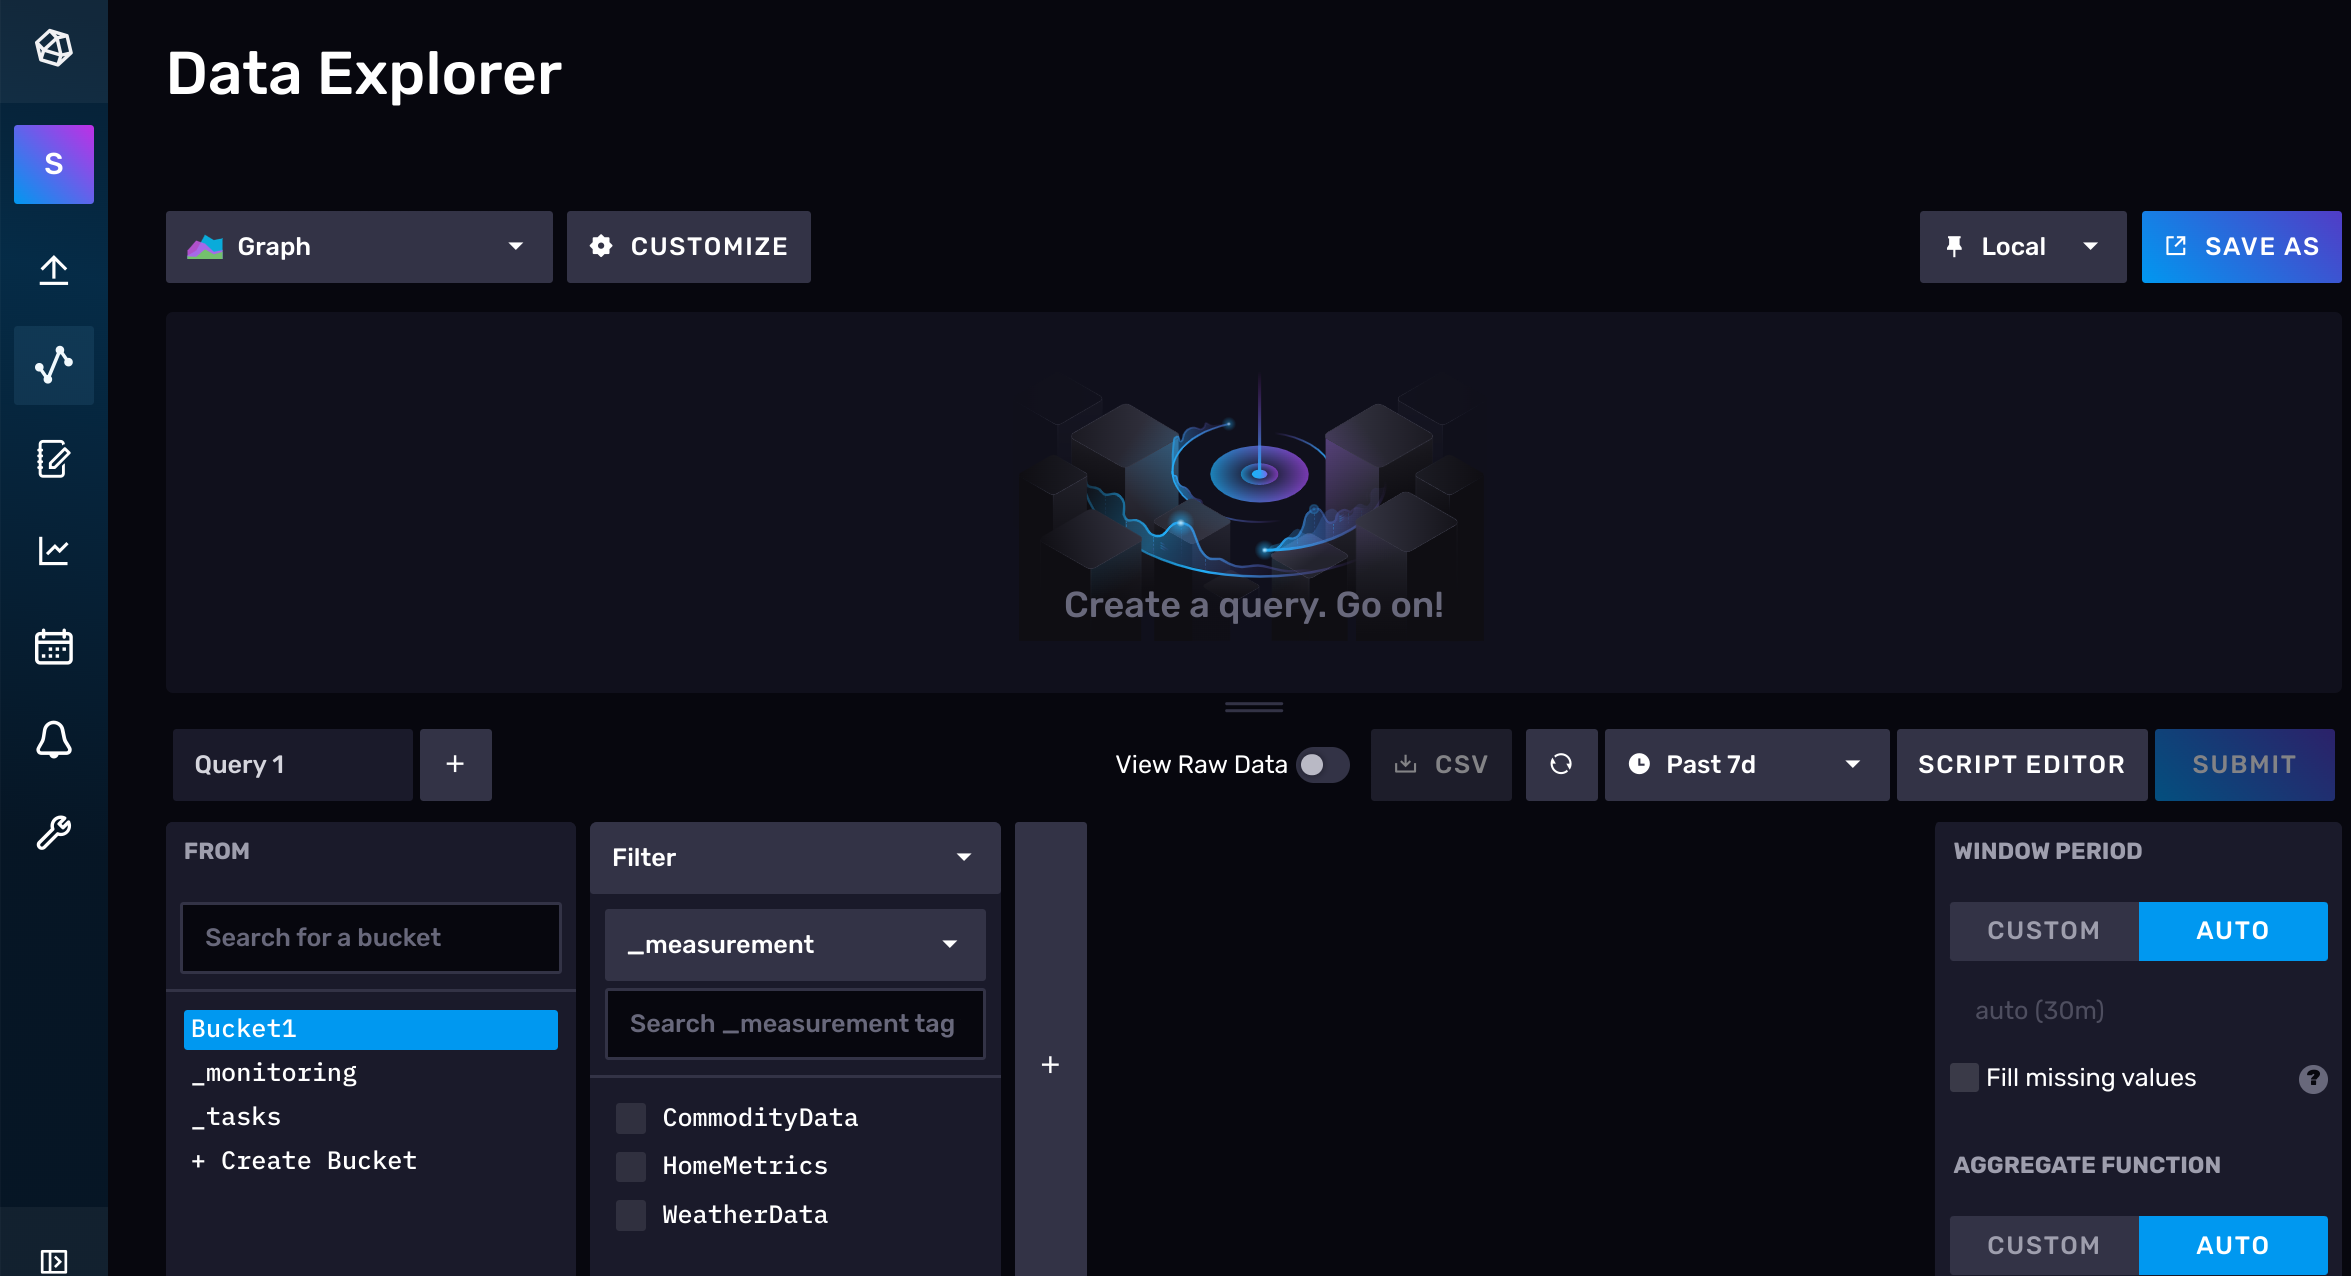
AFAIK everything is measured in “$” so I’m not sure why I get such a smaller dataset when I put that measurement in… maybe I’ve done that line wrong?

Can you switch to builder? (click on Query Builder)
image

and then see how many measurments you have in your bucket “hacore”?
image

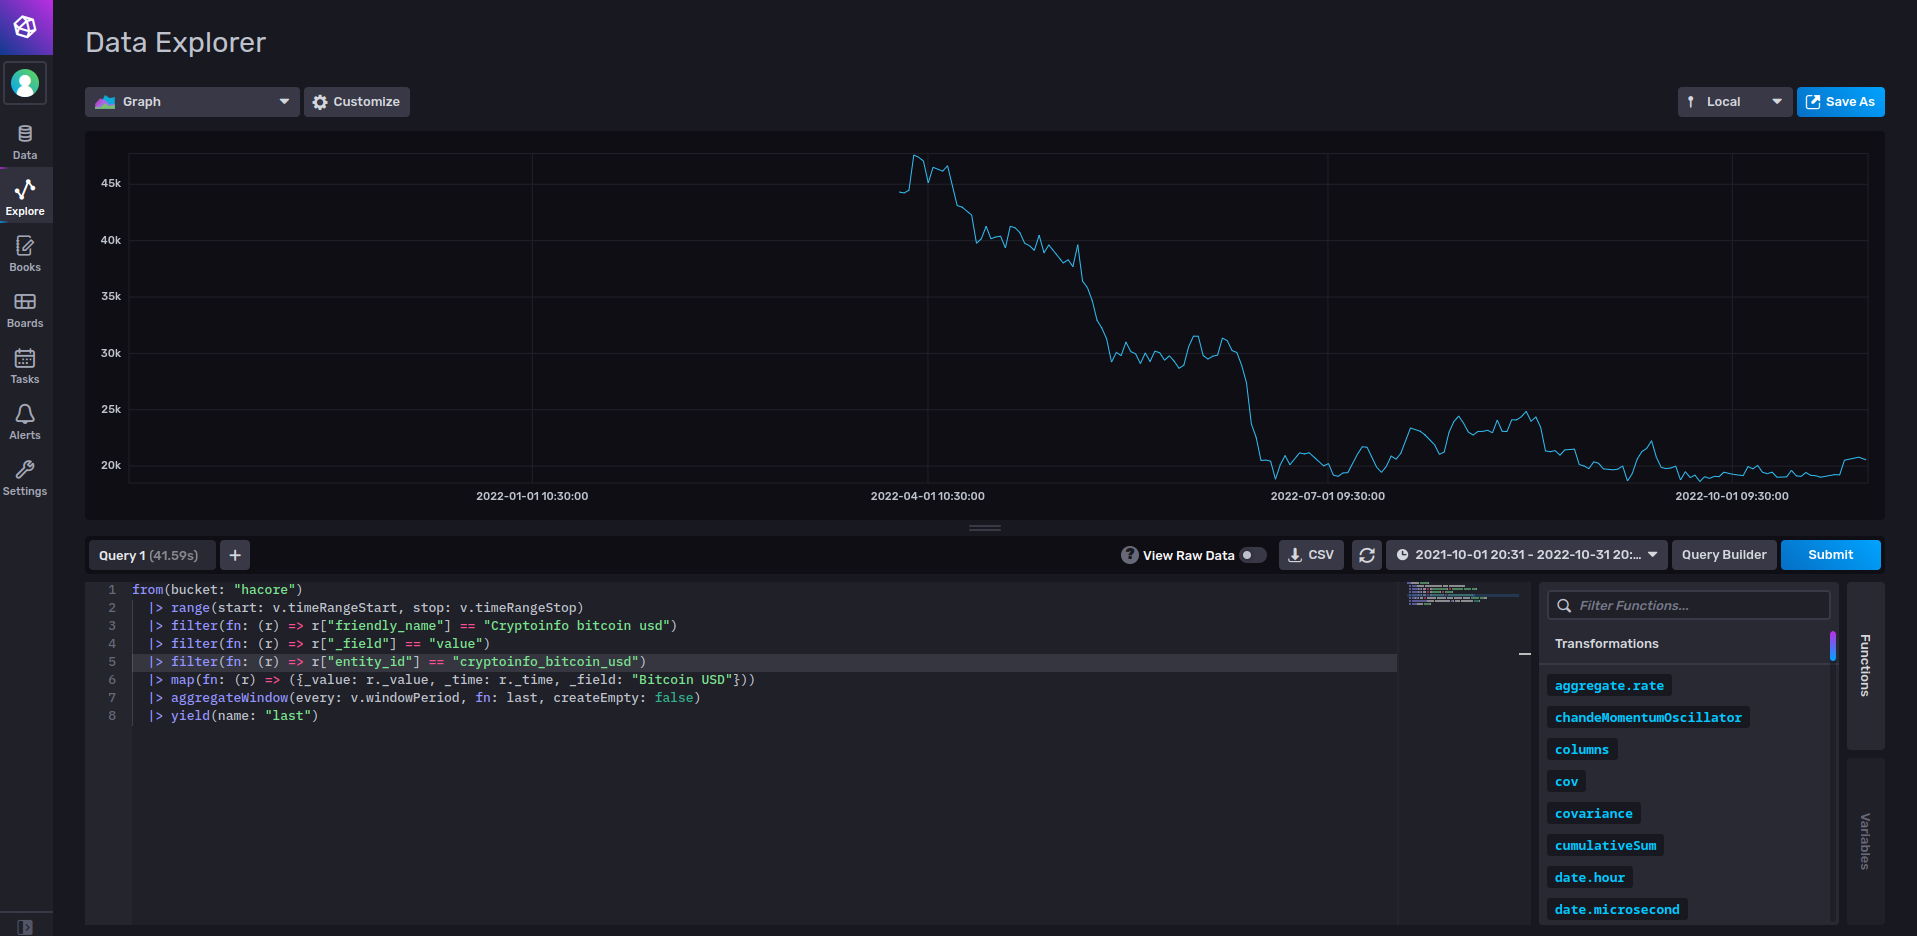
I think I solved it as there was more than one value data causing some bizarre outputs… this is HA’s input fault… it must have not been including the value type for some time somewhere a long the line:

  |> filter(fn: (r) => r["_measurement"] == "$" or r["_measurement"] == "​")
2 Likes