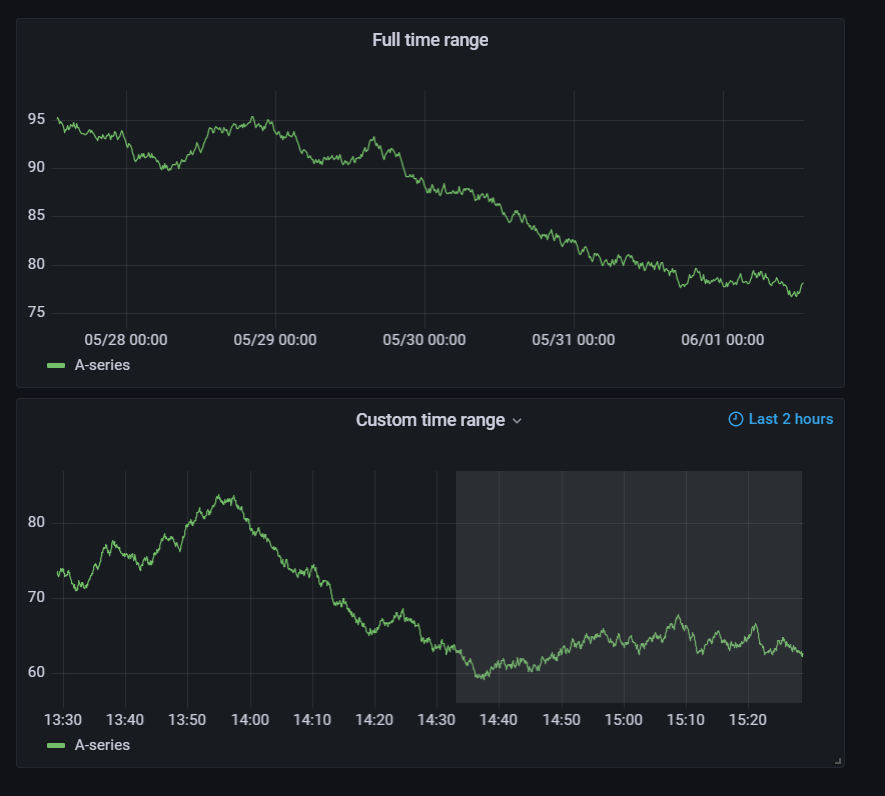
In a dashboard, there is a panel with a fixed time range:
It works as intended. However when I change the time selection in it, the time selection applies to the entire dashboard.
From my understanding, the idea of this feature is to have the time range from panels like this isolated from the dashboard time range. This means that changing the dashboard time range shouldn’t affect the time range of the panel, but also the other way around: changing the time range in the panel shouldn’t affect the dashboard time range.
I’d like to understand
If this behaviour is intentional or a bug
If intentional, what’s the reasoning behind it
Whether there’s a setting to prevent this from happening
That looks like a bug, but you need to prove it with the latest Grafana version (8.5.3 atm). I would say start new dedicated latest Grafana from the scratch and try to reproduce it there in different browsers. It can be also something in your browser.
I’ve set up a test dashboard in Grafana Cloud which runs on v8.5.2, so unless this luckily got fixed in the latest revision it’s still there.
My intention was to publish a snapshot of it here, but it seems like custom time ranges don’t really work, i.e. the data is filtered but the panel shows the whole period, see here.
In any case, a few screenshots will do:
Initial state: works as intended