
-
What Grafana version and what operating system are you using?
Grafana v12.1.0 (ccd7b6ce7e) -
What are you trying to achieve?
I am using variables to calculate today, yesterday, this week etc. based input data from an Influx DB to be used in several queries.
that leads to a unix timestamp -
How are you trying to achieve it?
each morning I do a refresh of the dashboard, but the variable id not updating - instead i need to click “edit” on the Dashboard and then simpy save the dashboard without any changes, but I need to select the option"update default variables values"
-
What happened?
variable stays on old value after refresh of the dashboard -
What did you expect to happen?
variables should refresh when refreshing the dashboard -
Can you copy/paste the configuration(s) that you are having problems with?
-
Did you receive any errors in the Grafana UI or in related logs? If so, please tell us exactly what they were.
-
Did you follow any online instructions? If so, what is the URL?


This means you are saving a new default value into that variable every day. Try: edit the dashboard JSON model manually and remove any default value for that dashboard variable, and save the dashboard.
Tx for the feedback - that doesnt make sense to me? the variable always has a value - my expectation would be that when I am refreshing the Dashboard the variables will be refreshed as well (run the underlying query of the variable) and the value will be updated
example of json data:
 {
        "current": {
          "text": "1704063600000000000",
          "value": "1704063600000000000"
        },
        "datasource": {
          "type": "influxdb",
          "uid": "ea5616d0-69d9-46e9-a58c-6028bf4fabb9"
        },
        "definition": "select last(LetztesJahr_TS) from Statistik",
        "hide": 2,
        "includeAll": false,
        "name": "LetztesJahr",
        "options": [],
        "query": "select last(LetztesJahr_TS) from Statistik",
        "refresh": 1,
        "regex": "",
        "type": "query"
      }
It makes sense: current is empty, so it will execute the query and use the result as the value. Current is not empty - the user saved that value as a current, so I will show it as a current value.
So did you try that?
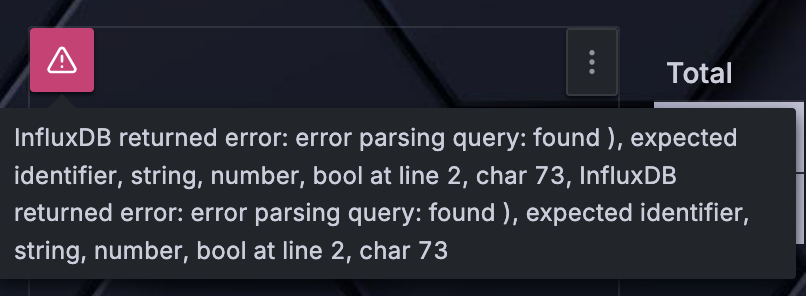
I didn’t mention to delete anything. Set "current": {}
this is what I did - deleted the content in the json file of the dashboard.
still not working - the variables are not updating to the new value when refreshing the dashboard. When I edit the variable and click “run query” its updating the value.
This is still broken (Grafana v13.1.0 (b309c9bb3b)) — query variables simply do not work.
If I set
``"current": {}
```
in the JSON then when I come to save the dashboard I cannot because it says there are no changes.
There is a checkbox for Update default variable values which makes it saveable, but obviously that will just keep the problem.
Based on your description, manually setting "current": {} doesn’t appear to be a practical workaround if Grafana won’t save the dashboard without another change.
One thing that would be useful to test is changing the variable’s Refresh mode from On dashboard load to On time range change and seeing whether that changes the behavior. If it does, that would help narrow down whether the issue is specific to the dashboard-load refresh path.
Also, when the value is stale, could you try opening the dashboard in a new browser tab (or doing a hard page reload) instead of using the dashboard refresh button? That would help determine whether the behavior differs between a full dashboard initialization and using the dashboard refresh button.
If the issue is still reproducible with a minimal dashboard containing a single query variable, I’d recommend opening a Grafana GitHub issue with the dashboard JSON and datasource details, since it has now been reported on both Grafana 12.1.0 and 13.1.0.
here is a small dashboard with one variable $Heute, which calculates today in Linux format
Error-Variable-1784979815038.json (3.1 KB)
Of course I have a datasource - otherwise I wouldnt get any result, just missed to check “export external”
Error-Variable-1784992158597.json (3.6 KB)
i do have a datasource - its an InfluxDB Version 1.10 called “solaranzeige” that is providing data from a solar power system. What you mean by “It is the “string” out we are trying to get out.” is it in the json data?
{
  "__inputs": [
{
"name": "DS_SOLARANZEIGE",
"label": "solaranzeige",
"description": "",
"type": "datasource",
"pluginId": "influxdb",
"pluginName": "InfluxDB"
...
From the dashboard JSON, $Heute is a query variable with Refresh = On Dashboard Load, so it will only be re-queried when the dashboard is loaded, not by the dashboard’s Refresh button. That matches what you’ve been seeing, where manually refreshing the dashboard doesn’t update the variable.
If $Heute is only meant to represent the start of the current day, you could compute that directly in your InfluxDB query instead and remove the variable entirely. If it represents something else (for example, a value calculated externally and stored in Heute_TS), then I don’t believe Grafana currently provides a built-in way to force query variables to re-run from the dashboard’s Refresh button.
Thanks for the response, I have more variables like this one: for week, month and year (even lastMonth …), which is more precise than Grafana built in ranges. And it was working in older versions of Grafana by refreshing the dashboard, not sure what the difference is between loading and refreshing.
good news: changed the variables to “Refresh - on time range change” - seems to work on both dashboards now (the example I added here and my original one) - when I reload the dashboard or even just switch from one tab back it has the new, correct values
Thanks for confirming. It sounds like changing the variables to Refresh → On Time Range Change resolved it for your dashboards.
With the variables set to On Time Range Change, Grafana is now re-running the variable queries in the situations you’ve tested, which explains why the values are updating correctly when you reload the dashboard or switch back to the tab.
It’s interesting that you remember the Refresh button behaving differently in older Grafana versions. If you can identify which Grafana version that behavior changed in, it may be worth opening an issue to determine whether it was an intentional change or a regression.
a version before the above one - not sure exactly which one.