Hi Everyone,
I’m using Grafana version - Grafana v11.1.0 (5b85c4c2fc) with the datasource as Prometheus.
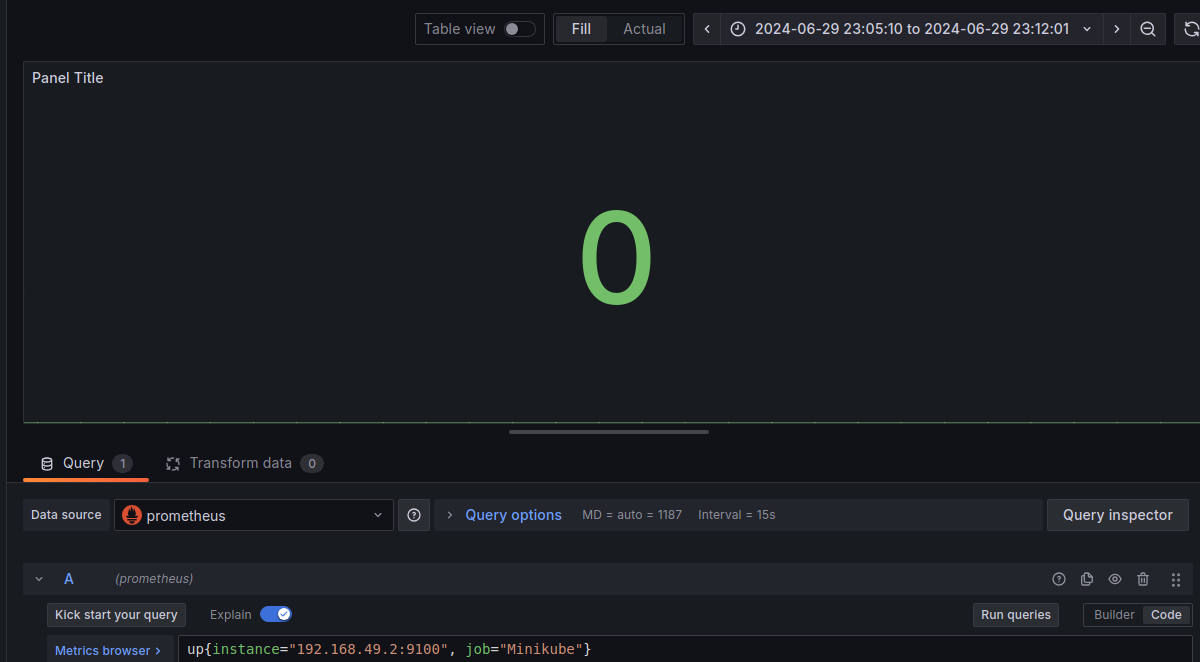
I trying to create a dashboard which shows the status of Minikube. When I run the graphQL, the value is returned as 0(Zero) in grafana and in promQL the value is returned as 1(One). Ideally as per my stats Grafana should be one(1).
Prometheus screenshot

Grafana screenshot
Any help would be highly appreciated.
Thanks