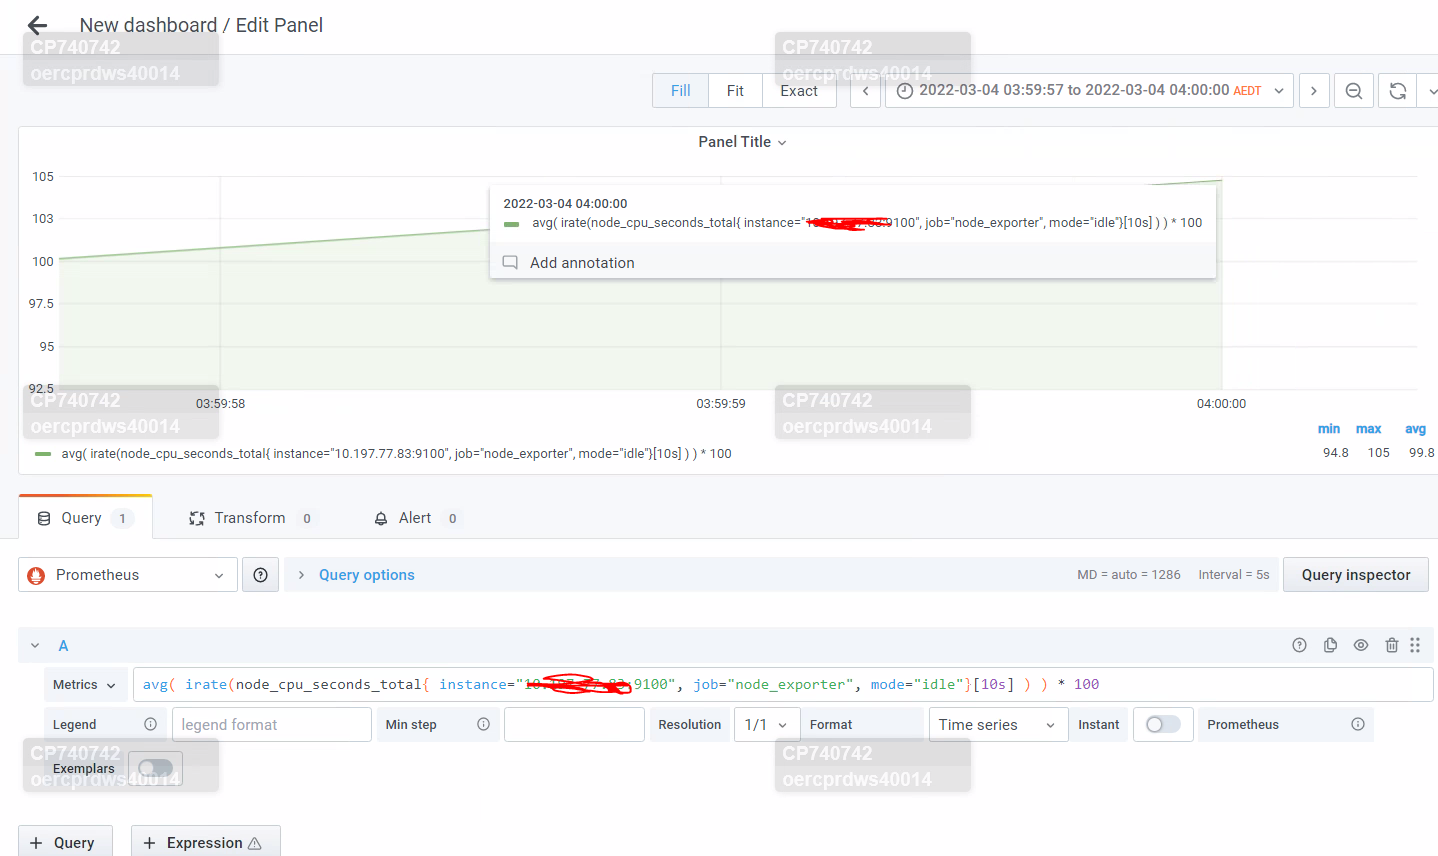
When trying to fetch the CPU idle team from Prometheus for a Linux node showing values 99.54

But while running same from grafana getting different values 105.
Grafana version :- 7.4.2
Prometheus version :- 2.25.0
When trying to fetch the CPU idle team from Prometheus for a Linux node showing values 99.54
Grafana version :- 7.4.2
Prometheus version :- 2.25.0
I think this has more to do with the peculiarities of the Prometheus rate function than an inconsistency with grafana. I love this video about the rate function:
