grafana shows very different cpu values on different time ranges. This is the query:
100 - (avg by (cpu) (irate(node_cpu{mode=“idle”, instance=~“$server”}[1m])) * 100)
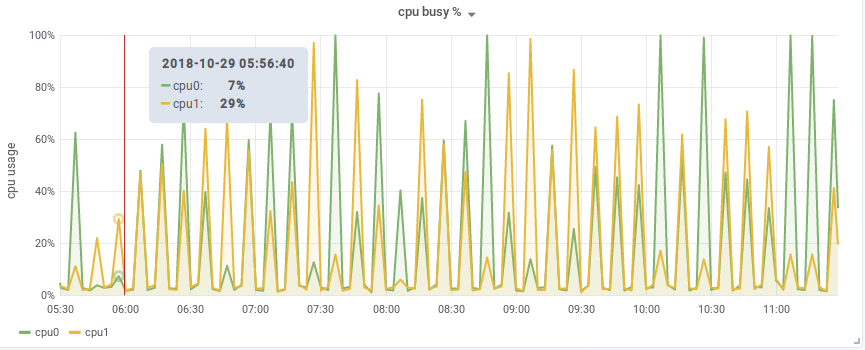
When I choose a 6-hour time range, the percentage on the same period is much higher than that of a 7-hour time range - probably because of a spike around 7 hours ago.
Please compare the two pictures.
Hi,
Thanks for the answer.
As can be seen in the query, the frequency is 1 minute. I changed it to 5 minutes. It’s exactly the same.
[update]
I changed it to 5 minutes and then back to 1 minute, then changed the time range several times and now it seems to be displaying the correct data. I’m not sure what’s going on. I’ll leave it be for a while and get back to you.
It’s nonetheless rather annoying, because the values are (were) misrepresented.
By the way, the resolution of the graph is 1/10. Not sure if this is the right one, but other resolutions seem to be displaying the data completely disproportionately.
After playing with it a little bit, it’s still the same. I’ve got the same problem. If the time range is higher than a certain time range (and, essentialy, it includes certain spikes), then it can’t solve the differences, it doesn’t observe the proportions. It’s as simple as that.
I would like to revive this thread, as I really don’t understand why grafana still behaves like that after one year with very different metrics.
I’ve got the following screenshots:
This one displays the time for the last hour:
I had problems like this on our HPC-Cluster in the University when we used Prometheus,
but since we switched to InfluxDB/Telegraf this problem is gone.
Did you check if the query graph in Prometheus itself shows the same behavior?
The issue is in irate() function. It calculates the rate based on two adjancent samples instead of calculating the rate based on all the samples per each step between points on the graph. When the time range for the graph changes, the set of samples used for irate() calculation also changes. So you see completely different graph. The solution is to use rate() instead of irate(). See the following article for details - Why irate from Prometheus doesn't capture spikes | by Aliaksandr Valialkin | Medium