Hi all,
I would like to have two queries in the same graph in Grafana, but with different style.
Table:
| Client |
OK Projects |
KO Projects |
| 1 |
23 |
3 |
| 2 |
50 |
1 |
| 3 |
34 |
1 |
| 4 |
57 |
1 |
| 5 |
22 |
7 |
| 6 |
45 |
3 |
| 7 |
10 |
0 |
| 8 |
2 |
0 |
| 9 |
45 |
2 |
| 10 |
18 |
5 |
And the visual result I expect is something like this:

But when I write both queries I cannot modify the style separately, so I get both visualizations as bars. There is a way to change the style of one of them to obtain the result?
Thanks in advance!
Best Regards,
You should be able to use Add series override in the Visualisation tab of the dashboard to override the settings for a particular series.
@clanlaw, thanks for your answer.
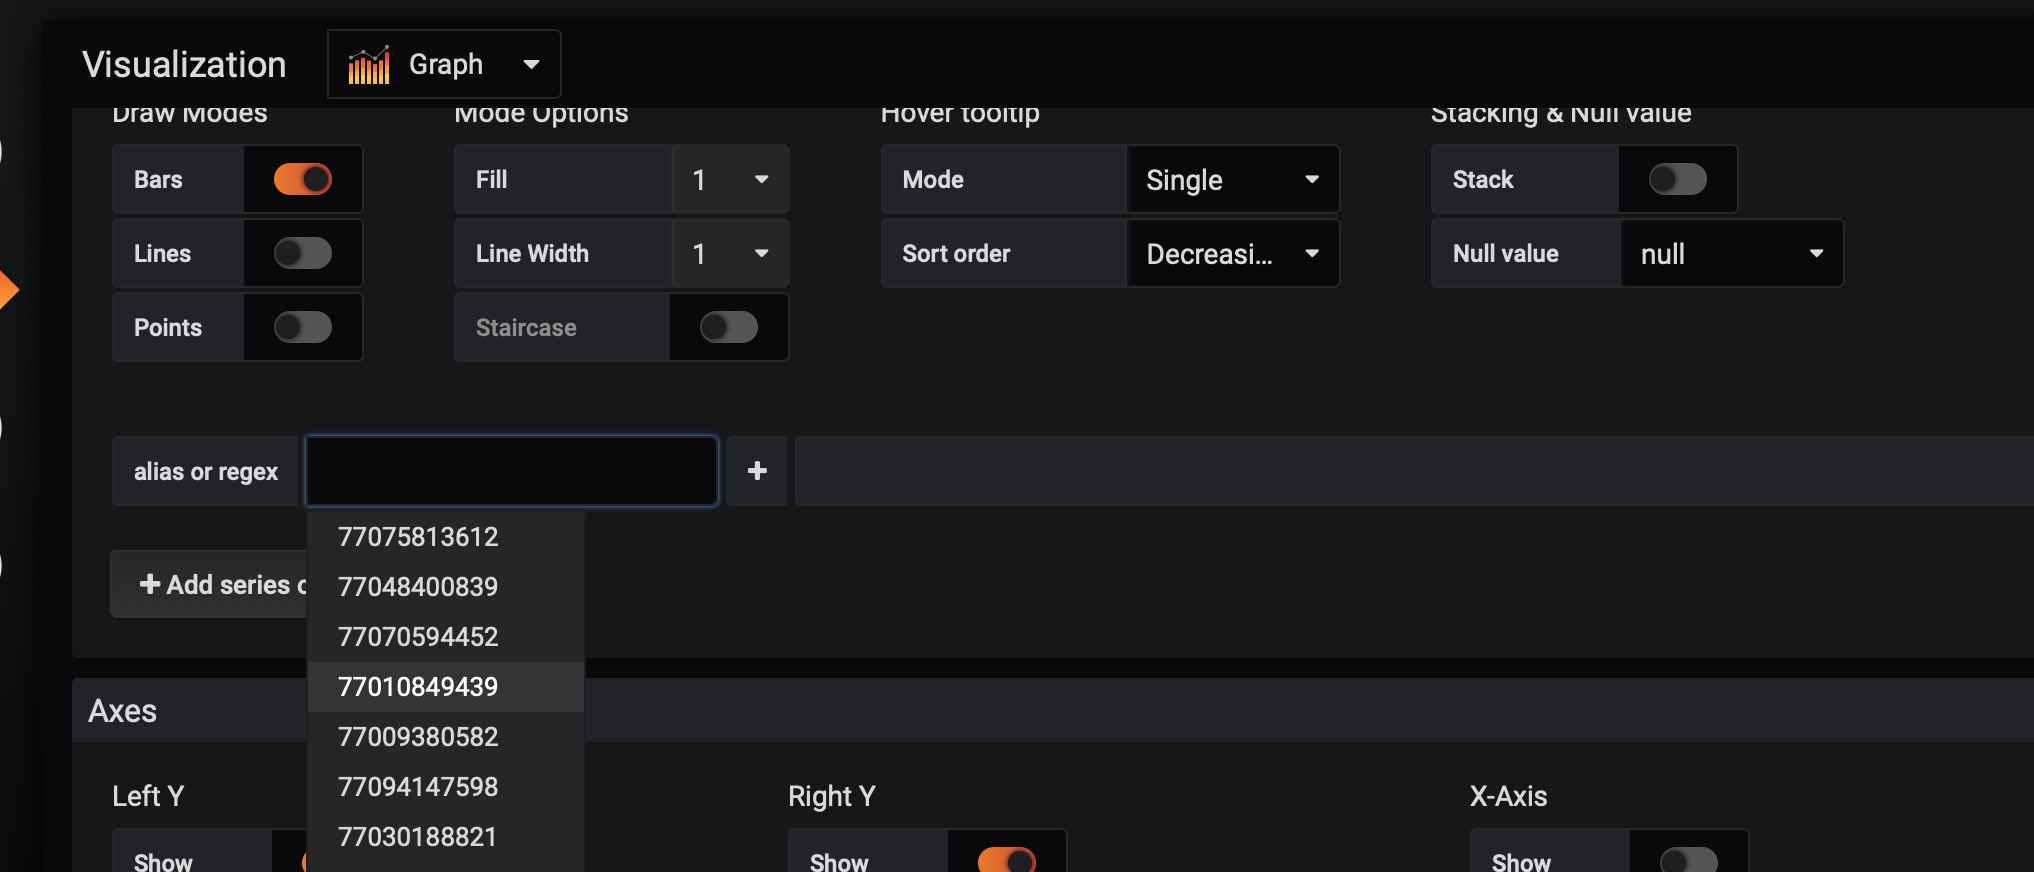
As I am new in Grafana, maybe I am not understanding the solution. In my case as in both queries the X axe is the same (client id) I can’t see the way to override the result for only one query, as shown in the image below, when I try to write the serie to override I get the client ID, as is the same in both queries:
OK Projects is in table1 and KO Projects in table2. My queries are:
A query:
SELECT
now() as time,
CAST(client as VARCHAR(50)) as metric,
MAX (ok_projects) as value
FROM
schema.table1
GROUP BY client;
B query:
SELECT
now () as time,
CAST(client as VARCHAR(50)) as metric,
COUNT (DISTINCT ko_projects) as value
FROM schema.table2
GROUP BY client;
My datasource is postgreSQL.
Thanks in advance!!
Best Regards,
You can edit the querys to:
SELECT
now() as time,
CAST(client as VARCHAR(50)) || "Y1" as metric,
MAX (ok_projects) as value
FROM
schema.table1
GROUP BY client;
And
SELECT
now () as time,
CAST(client as VARCHAR(50)) || "Y2" as metric,
COUNT (DISTINCT ko_projects) as value
FROM schema.table2
GROUP BY client;
And in the series override you can use regex in name of metrics
/.*Y1/
/. *Y2/
Hi @danielgonzalez ,
That solves the problem of formatting each query independently.
Now I have one more question. I would like to get for the same client ID, lets say clientID=3 both values in the same Y axis, now I am getting all the values for the first query and then the values of the second one. There is a way to overlap both queries so I can see easily for each user the number of successful projects and the number of KO projects? ( as in the post image)
Thanks a lot for your help!! 
Here an image of both queries in sequence:
Hi,
did you find a solution for this problem?
1 Like