Hi,
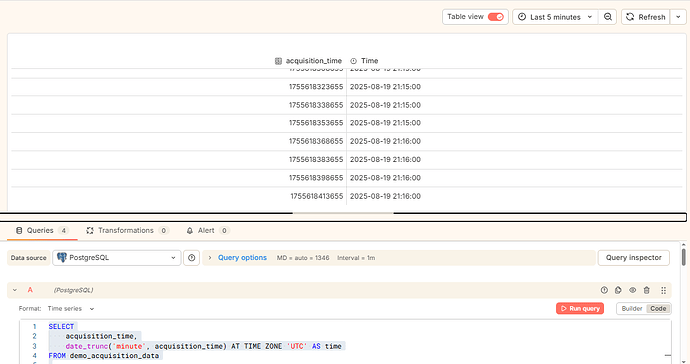
I am running some queries to trino via Grafana, but got an unexpected result. The timeGroup ( (other time function such as date_trunc) showed a 2-hour delay compared to the original column (acquisition_time). I do not think it is an issue with Trino because it showed what I had expected in the acquisition_time. I tried different intervals, but the issue remains.
Thank you.
Temporary fix: I added 2 hours to the time column.
Grafana: 12.0.2
Trino: 475
Database: UTC
Browser: Local Time (PDT)
Use the query inspector and check generated SQL + update it for your need. Set dashboard to UTC timezone at least during debugging.
Hello @kdangocergy ,
I’ve implemented this scenario using dummy timestamp data and encountered the same issue. However, you can resolve it by modifying your query. Please follow the steps below to address the problem:
Step 1. Create a table and Insert dummy tmestamp data.
Step 2. Connect the data source to Grafana
Step 3. Modify the Query to Handle Time Zone Conversion
SELECT
  acquisition_time,
  date_trunc('minute', acquisition_time AT TIME ZONE 'Asia/Kolkata') AT TIME ZONE 'UTC' AS time
FROM demo_acquisition_data;
Final Result :-
Without Time Zone Adjustment:
With Time Zone Adjustment in Query:
Real Data
Hi @kdangocergy
Just checking in—did this solution resolve your issue, or are you still facing the same problem?


