I need to group data by month using ‘created’ field for timeSeries. For this purpose I am using
$__timeGroupAlias(created,$__interval,0)
and
$__timeGroup(created,$__interval,0) + 14400 as time
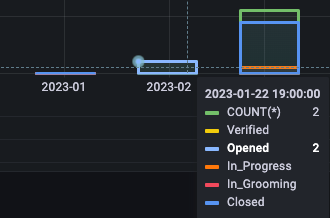
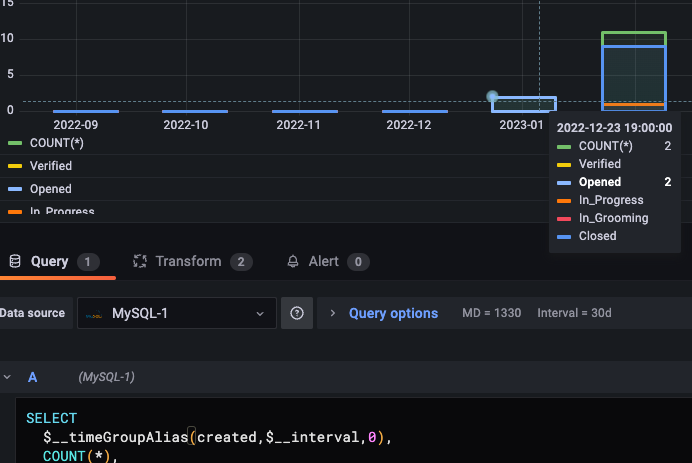
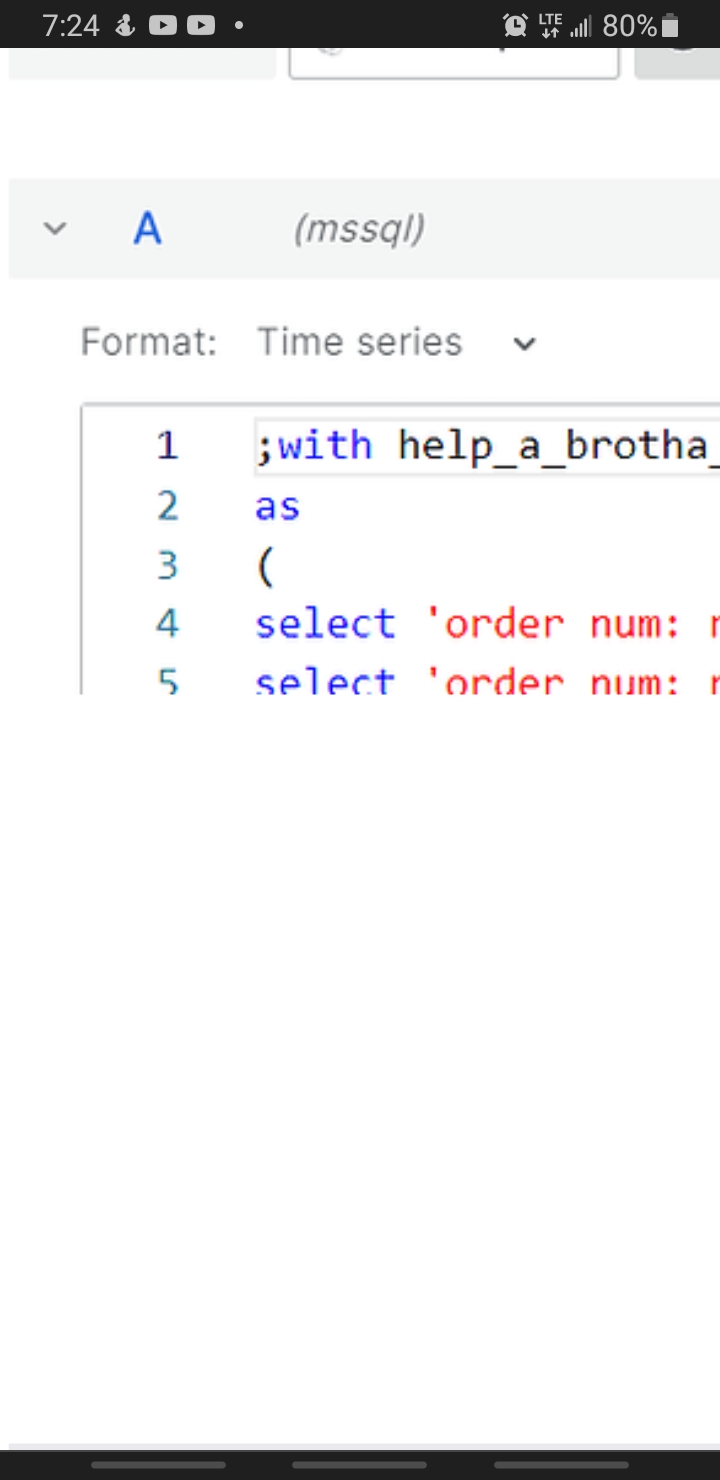
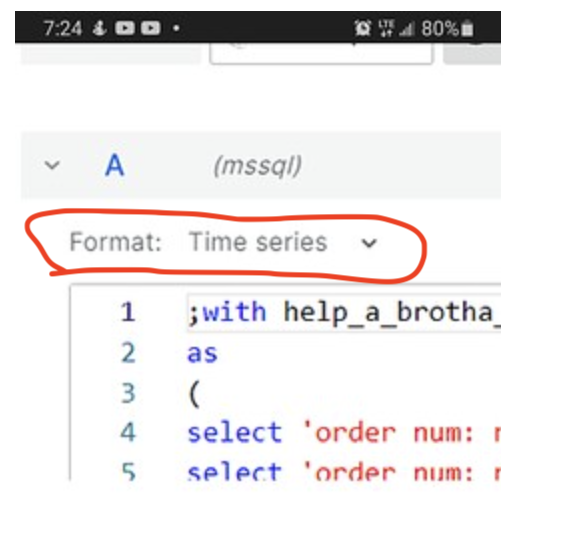
The data are grouped but is not correct, e.g. part of January data is grouped in February. The table, graph view and query options on a screenshots below
My query is
SELECT
$__timeGroup(created,$__interval,0) + 14400 as time,
COUNT(*),
SUM(CASE WHEN status = ‘Verified’ THEN 1 END) as Verified,
SUM(CASE WHEN status = ‘Opened’ THEN 1 END) as Opened,
SUM(CASE WHEN status = ‘In Progress’ THEN 1 END) as In_Progress,
SUM(CASE WHEN status = ‘In Grooming’ THEN 1 END) as In_Grooming,
SUM(CASE WHEN status = ‘Closed’ THEN 1 END) as Closed
FROM jira_metric_record1
Where
$__timeFilter(created) AND
labels LIKE ‘%prod_defect%’
GROUP BY 1
ORDER BY 1
The question is how to define correct months grouping?
What is the number “14400”? What database are you using? Why did you set the “Interval” as “30d”, is the data get generated/written to the DB each 30 days?
Thanks, applied your suggestion but got error: db query error: Error 1054: Unknown column ‘‘UTC’’ in ‘field list’
yes am in ET US time zone. The Timezone set Browser Time
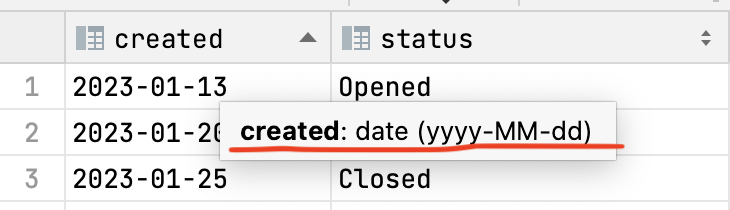
and second one question, why following works as expected in outside Grafana for table
DATE_FORMAT(created, ‘%Y-%m’) as time,
but doesn’t work in Grafana. I tried
FROM_UNIXTIME(UNIX_TIMESTAMP(DATE_FORMAT(created ,‘%Y-%m’))) AS time
but got only one record for whole year with weird date
the query is
SELECT
STR_TO_DATE(DATE_FORMAT(created, ‘%Y-%m-01’), ‘%Y-%m-%d’) as time,
COUNT(*) AS num_defects,
COUNT(CASE WHEN status = ‘Opened’ THEN 1 ELSE NULL END) AS opened_defect,
COUNT(CASE WHEN status = ‘Verified’ THEN 1 ELSE NULL END) AS verified_defect,
COUNT(CASE WHEN status = ‘In Progress’ THEN 1 ELSE NULL END) AS in_progress,
COUNT(CASE WHEN status = ‘In Grooming’ THEN 1 ELSE NULL END) AS in_grooming,
COUNT(CASE WHEN status = ‘Closed’ THEN 1 ELSE NULL END) AS closed_defect
FROM
jira_metric_record_year
WHERE
labels LIKE ‘%prod_defect%’
AND created >= DATE_SUB(NOW(), INTERVAL 1 YEAR)
GROUP BY
time
ORDER BY
time;
Because there is no timezone information stored with the timestamp, Grafana treats it as UTC and subtract 5 hours (US Eastern), so 2023-01-01 00:00:00 becomes 2022-12-31 19:00:00.
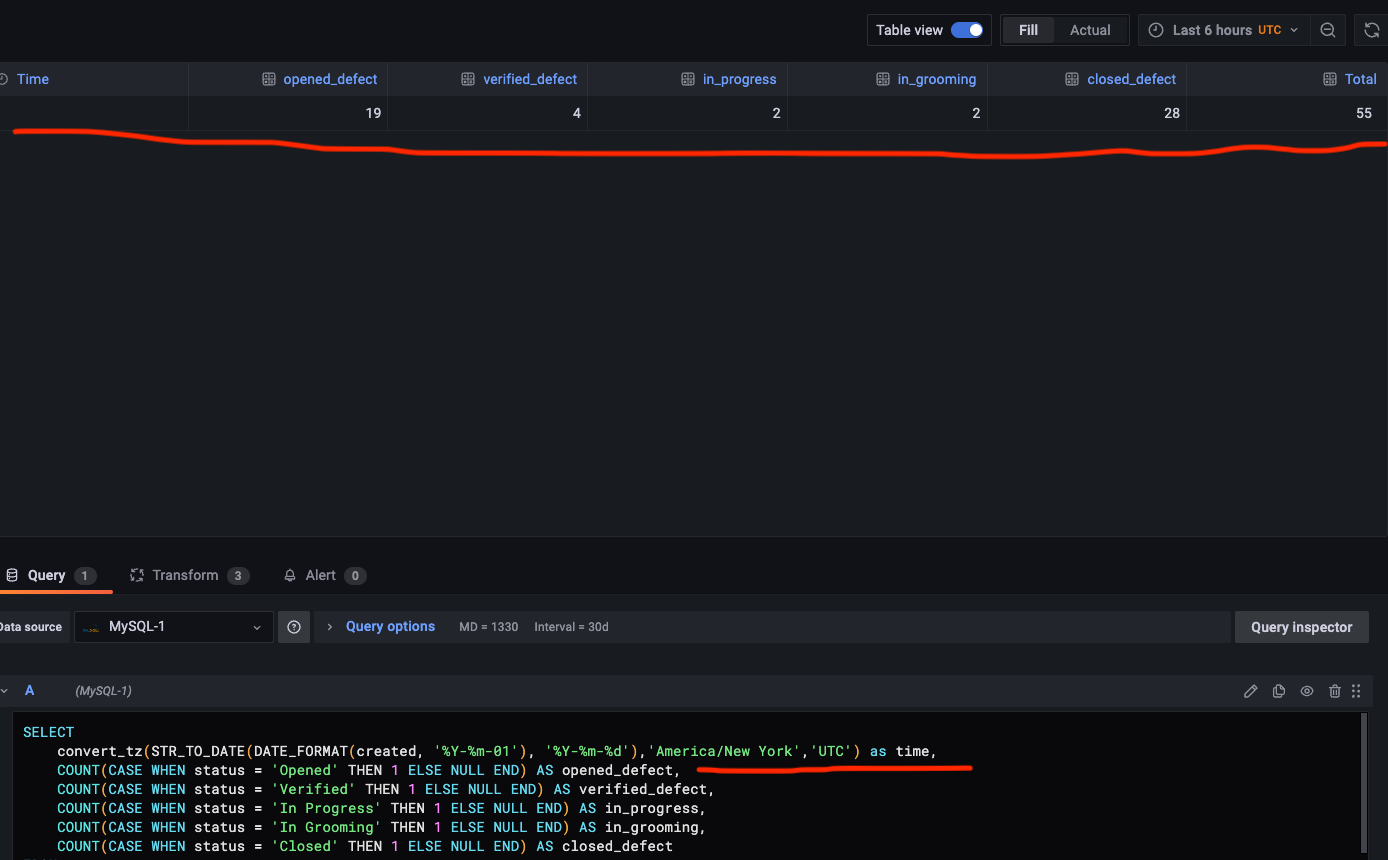
You need to convert the timezone within the query.
Hello,
I am sorry for late response, the line below brought only one entry in the table
convert_tz(STR_TO_DATE(DATE_FORMAT(created, ‘%Y-%m-01’), ‘%Y-%m-%d’),‘America/New York’,‘UTC’) as time,
SELECT
STR_TO_DATE(DATE_FORMAT(created, '%Y-%m-01'), '%Y-%m-%d) as time,
COUNT(CASE WHEN status = 'Opened' THEN 1 ELSE NULL END) AS opened_defect,
COUNT(CASE WHEN status = 'Verified' THEN 1 ELSE NULL END) AS verified_defect,
COUNT(CASE WHEN status = 'In Progress' THEN 1 ELSE NULL END) AS in_progress,
COUNT(CASE WHEN status = 'In Grooming' THEN 1 ELSE NULL END) AS in_grooming,
COUNT(CASE WHEN status = 'Closed' THEN 1 ELSE NULL END) AS closed_defect
FROM
jira_metric_record1
WHERE
labels LIKE '%prod_defect%'
GROUP BY
time
ORDER BY
time;