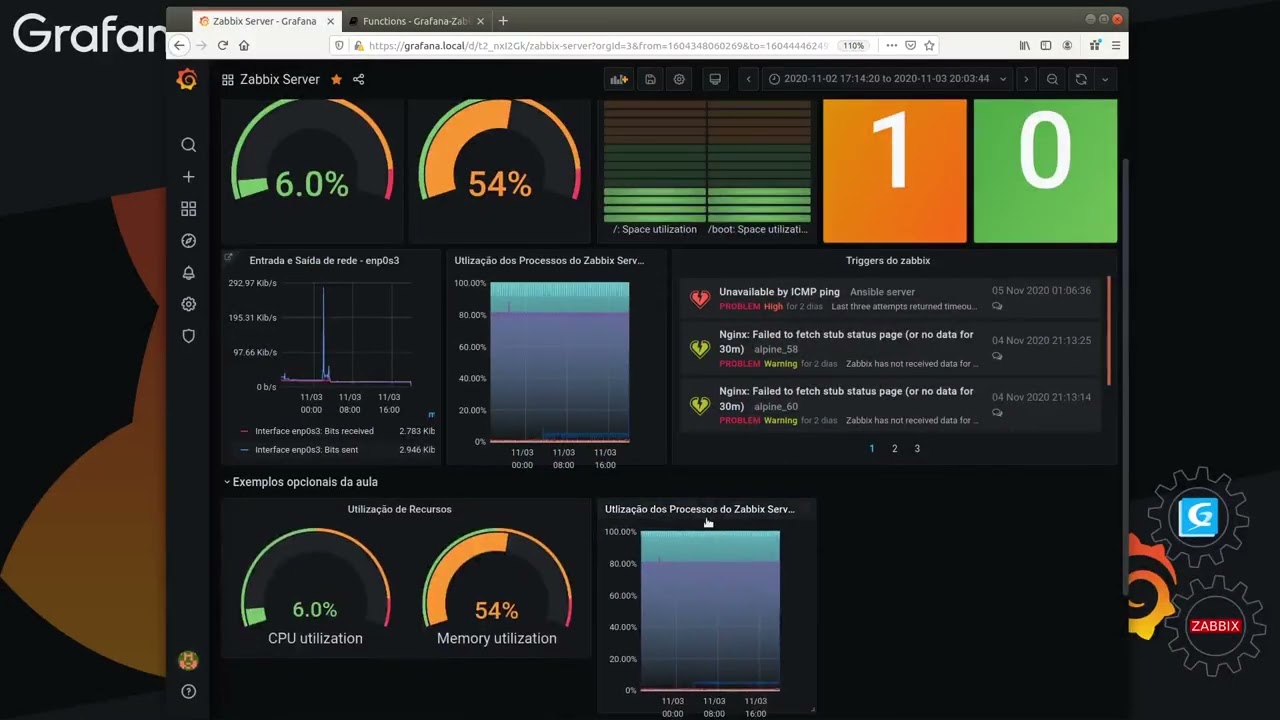
Hello everyone and thank you for accepting me into your community.
Grafana is new for me.
my aim is to calculate the total traffic consumption of a router’s LTE interface.
I created the Zabbiz data source. I can get the Bit send and Bit receive data, but I can’t create a function to calculate the total volume of traffic that passes through the interface. For example, knowing how many GB I consumed in a month.
Grafana version v10.3.1
Thank you
HI,
thanks for the tip but Regex doesn’t work.
furthermore, I believe that in this way the sum between bit send and bit receive is calculated, but what if I wanted to know the total volume of traffic consumed? for example see how many GB my SIM card has consumed
I also tried to do a transformation by adding send and receive… but over time it always shows me 1.54T
The regex works… That “1” transformation lingering there is the problem.
If you’d like to try some automatic subtitle from Brazilian Portuguese you can check out this lesson, that shows exactly what you want at 13 minutes:
Hi, I managed to get the regex working.
if I use /Interface lte1(): Bits./ it doesn’t work…
if I use /Interface lte1(): ./ it doesn’t work…
if I remove the colon it gives me all the LTE1 items
I had to set the regex like this: /Bits.*/ and it works.
However, in this way with the sumseries it gives me (as in the video) the sum between Bit send and Bit receive expressed in Mbps… What I want instead is to have the conversion from mbps to Data volume for a certain period. Thank you
You should rethink your Zabbix data gathering side. As I said before, it’s better to do the calculation and get the right data at the Datasource’s side, not in Grafana’s side.
And, as a bonus, IMHO for the volume of data that flows on an interface, most of the time the Bits send/received/total aren’t a good measure. In your place I’d think/evaluate about getting something like Elastic Network Beat or Cert NetSA Silk to use Netflow to filter the protocols and have the right information.
HI,
ok thanks, I will try directly on zabbix.
Thank you for your support
1 Like


