Hi all,
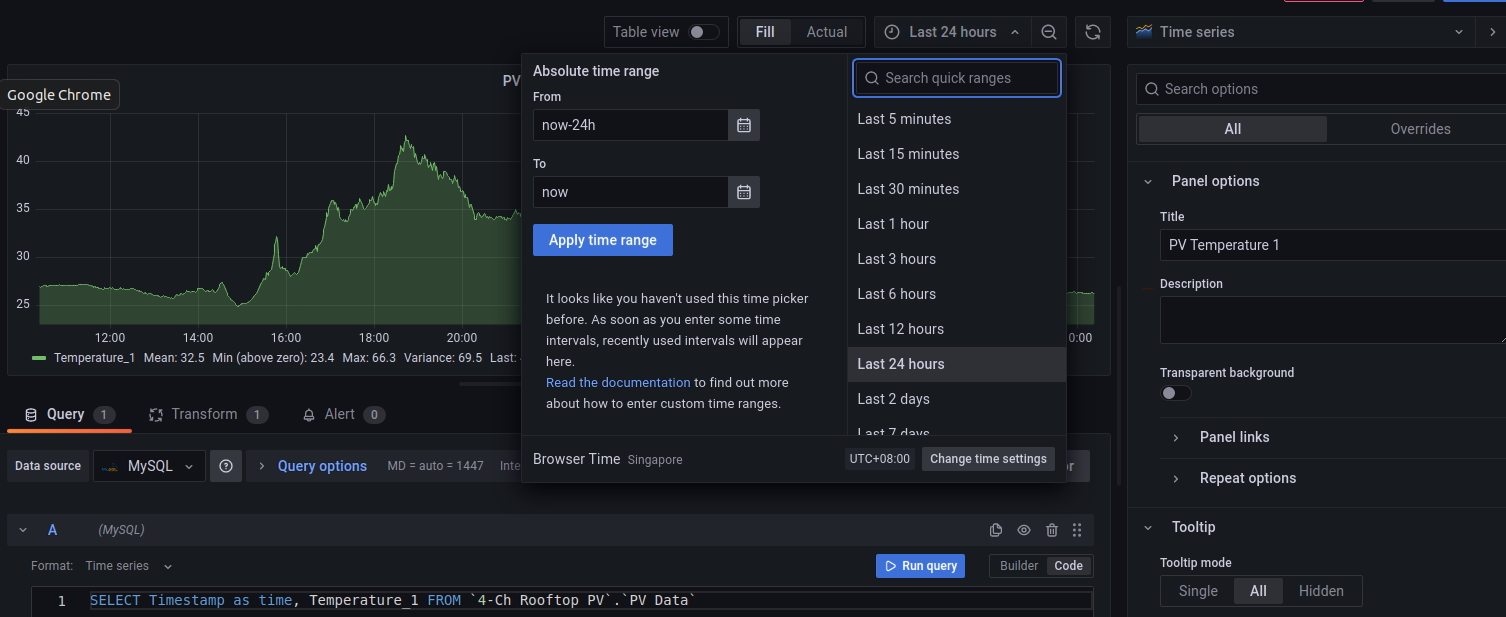
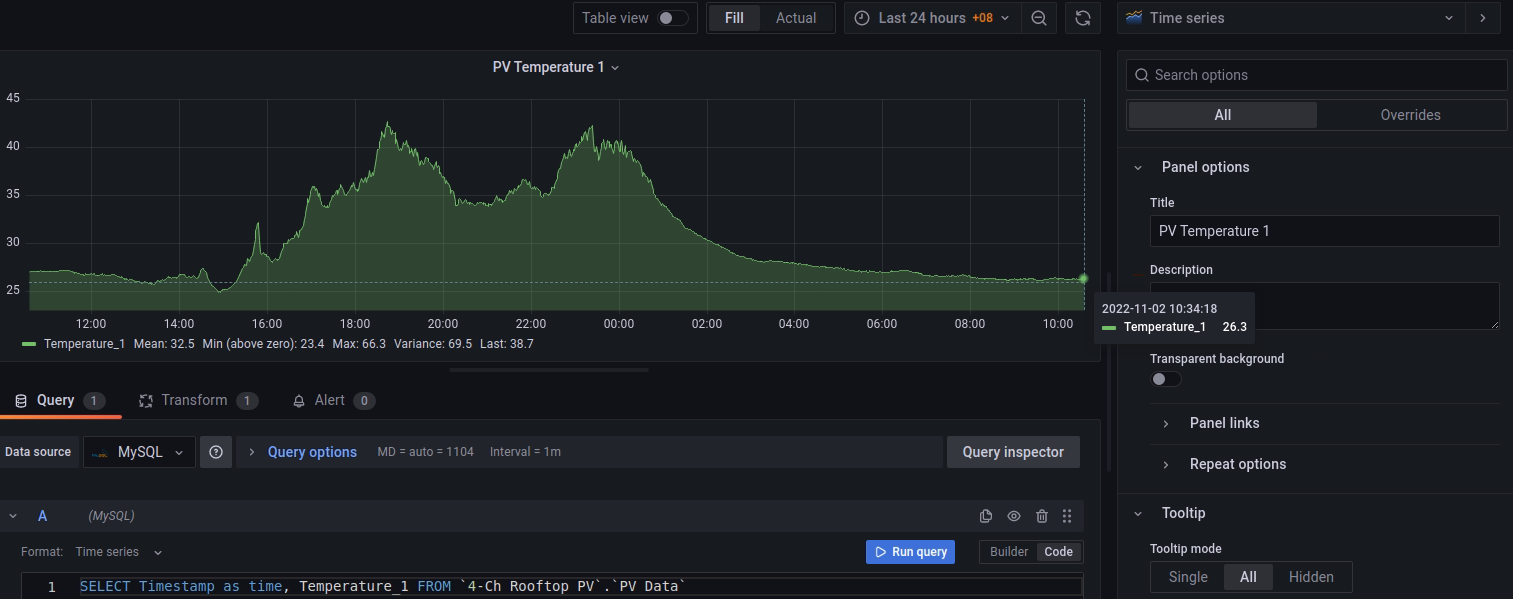
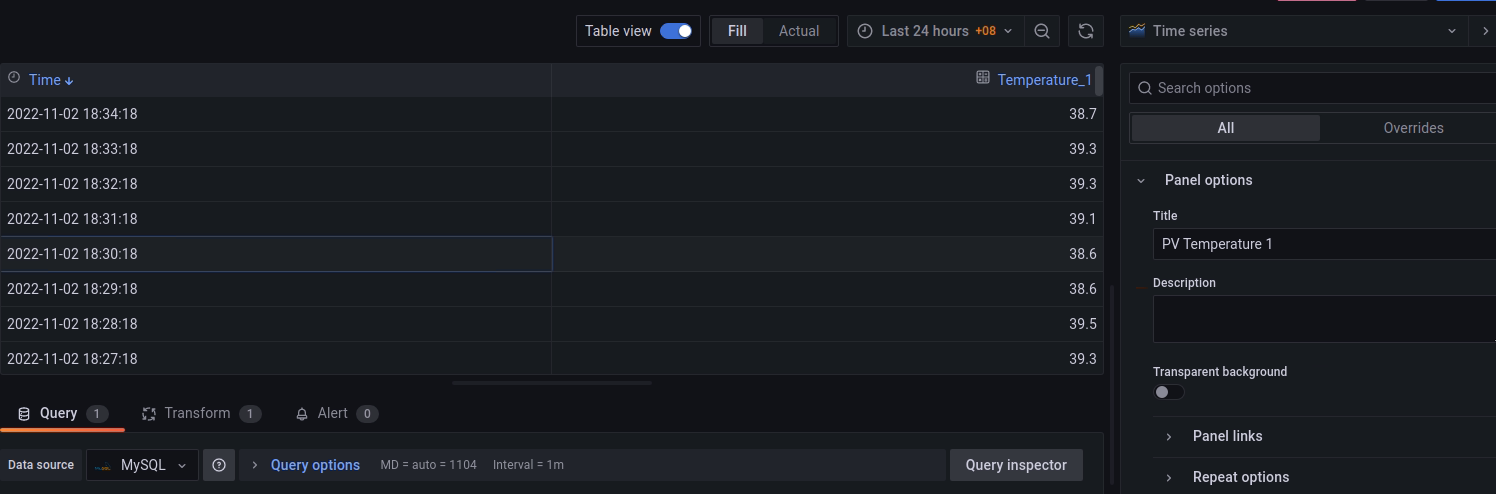
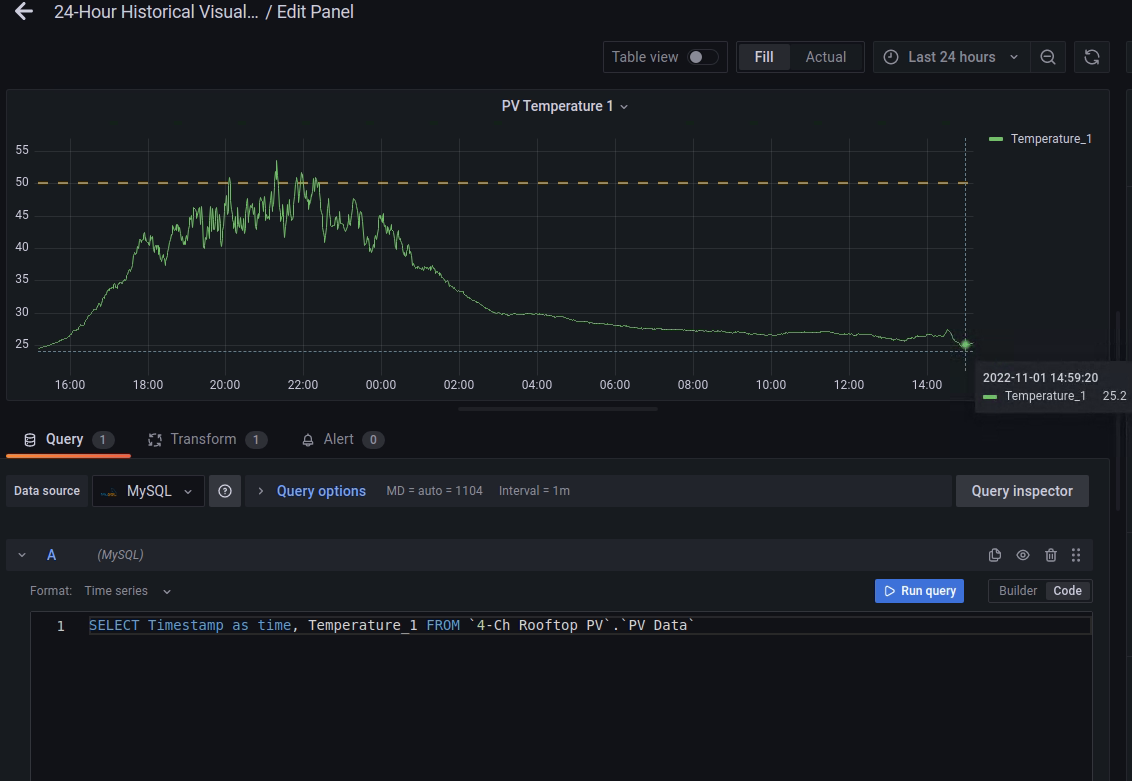
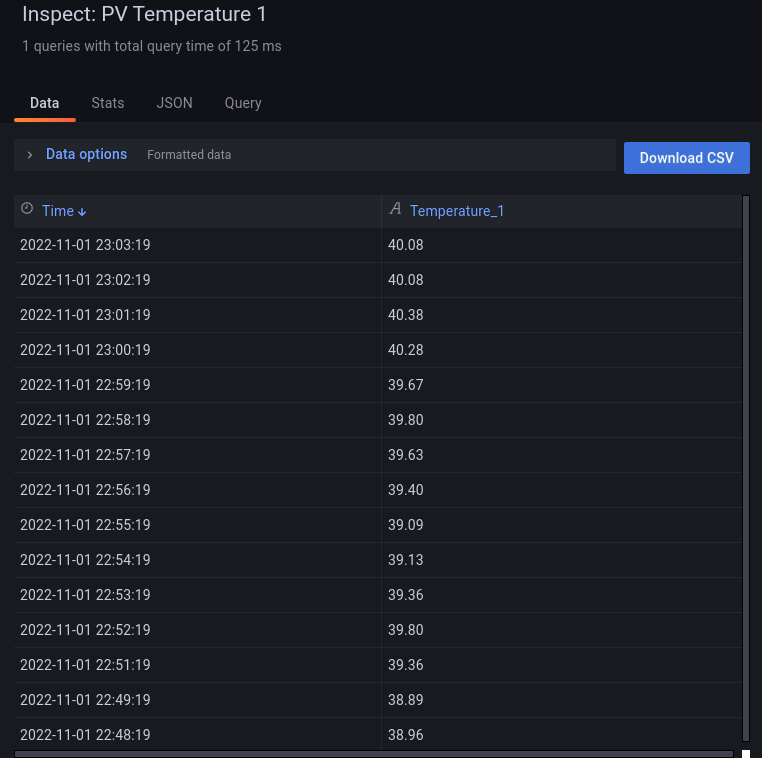
I have just started to explore on Grafana and trying to create dashboards using the data from my local MySQL DB. The issue that I am facing is that the time-series graph that I generated does not match with my database. I live in Singapore and I have set the time zone to be in UTC + 8 accordingly. I noticed that from the data table, the Temperature_1 values are correct, but the Time is displayed is not correct. For example, the time shown is 23.00 but it is 3pm here in Singapore. I also do not know why value displayed in the graph is different from this data. Previously I’ve had issues in visualizing the time-series data but managed to use the “Convert Field Type Transform feature” from other posts have included the panel JSON and screenshots of the output. Kindly advise on how to solve the issue, thanks.
https://community.grafana.com/t/new-dashboard-edit-panel/73994

{
  "id": 34,
  "gridPos": {
    "h": 9,
    "w": 24,
    "x": 0,
    "y": 11
  },
  "type": "timeseries",
  "title": "PV Temperature 1",
  "transformations": [
    {
      "id": "convertFieldType",
      "options": {
        "conversions": [
          {
            "destinationType": "number",
            "targetField": "Temperature_1"
          }
        ],
        "fields": {}
      }
    }
  ],
  "datasource": {
    "type": "mysql",
    "uid": "yuC_g1N4k"
  },
  "pluginVersion": "9.2.2",
  "fieldConfig": {
    "defaults": {
      "custom": {
        "drawStyle": "line",
        "lineInterpolation": "linear",
        "barAlignment": 0,
        "lineWidth": 1,
        "fillOpacity": 0,
        "gradientMode": "none",
        "spanNulls": false,
        "showPoints": "auto",
        "pointSize": 5,
        "stacking": {
          "mode": "none",
          "group": "A"
        },
        "axisPlacement": "auto",
        "axisLabel": "",
        "axisColorMode": "text",
        "scaleDistribution": {
          "type": "linear"
        },
        "axisCenteredZero": false,
        "hideFrom": {
          "tooltip": false,
          "viz": false,
          "legend": false
        },
        "thresholdsStyle": {
          "mode": "dashed"
        }
      },
      "color": {
        "mode": "palette-classic"
      },
      "mappings": [],
      "thresholds": {
        "mode": "absolute",
        "steps": [
          {
            "color": "green",
            "value": null
          },
          {
            "color": "#EAB839",
            "value": 50
          },
          {
            "color": "red",
            "value": 60
          }
        ]
      }
    },
    "overrides": []
  },
  "options": {
    "tooltip": {
      "mode": "single",
      "sort": "none"
    },
    "legend": {
      "showLegend": true,
      "displayMode": "list",
      "placement": "right",
      "calcs": [],
      "width": 120
    },
    "timezone": [
      "Asia/Singapore"
    ]
  },
  "targets": [
    {
      "dataset": "4-Ch Rooftop PV",
      "datasource": {
        "type": "mysql",
        "uid": "yuC_g1N4k"
      },
      "editorMode": "code",
      "format": "time_series",
      "rawQuery": true,
      "rawSql": "SELECT Timestamp as time, Temperature_1 FROM `4-Ch Rooftop PV`.`PV Data`",
      "refId": "A",
      "sql": {
        "columns": [
          {
            "parameters": [
              {
                "name": "Current_1",
                "type": "functionParameter"
              }
            ],
            "type": "function"
          }
        ],
        "groupBy": [
          {
            "property": {
              "type": "string"
            },
            "type": "groupBy"
          }
        ],
        "limit": 50
      },
      "table": "PV Data"
    }
  ]
}