Documentation
Ask Grot AI
Plugins
Get Grafana
Grafana Labs Community Forums
MySQL timeseries data not displayed correctly
Grafana
MySQL
mysql
,
time-series-panel
ekjotsingh
April 29, 2022, 11:39am
1
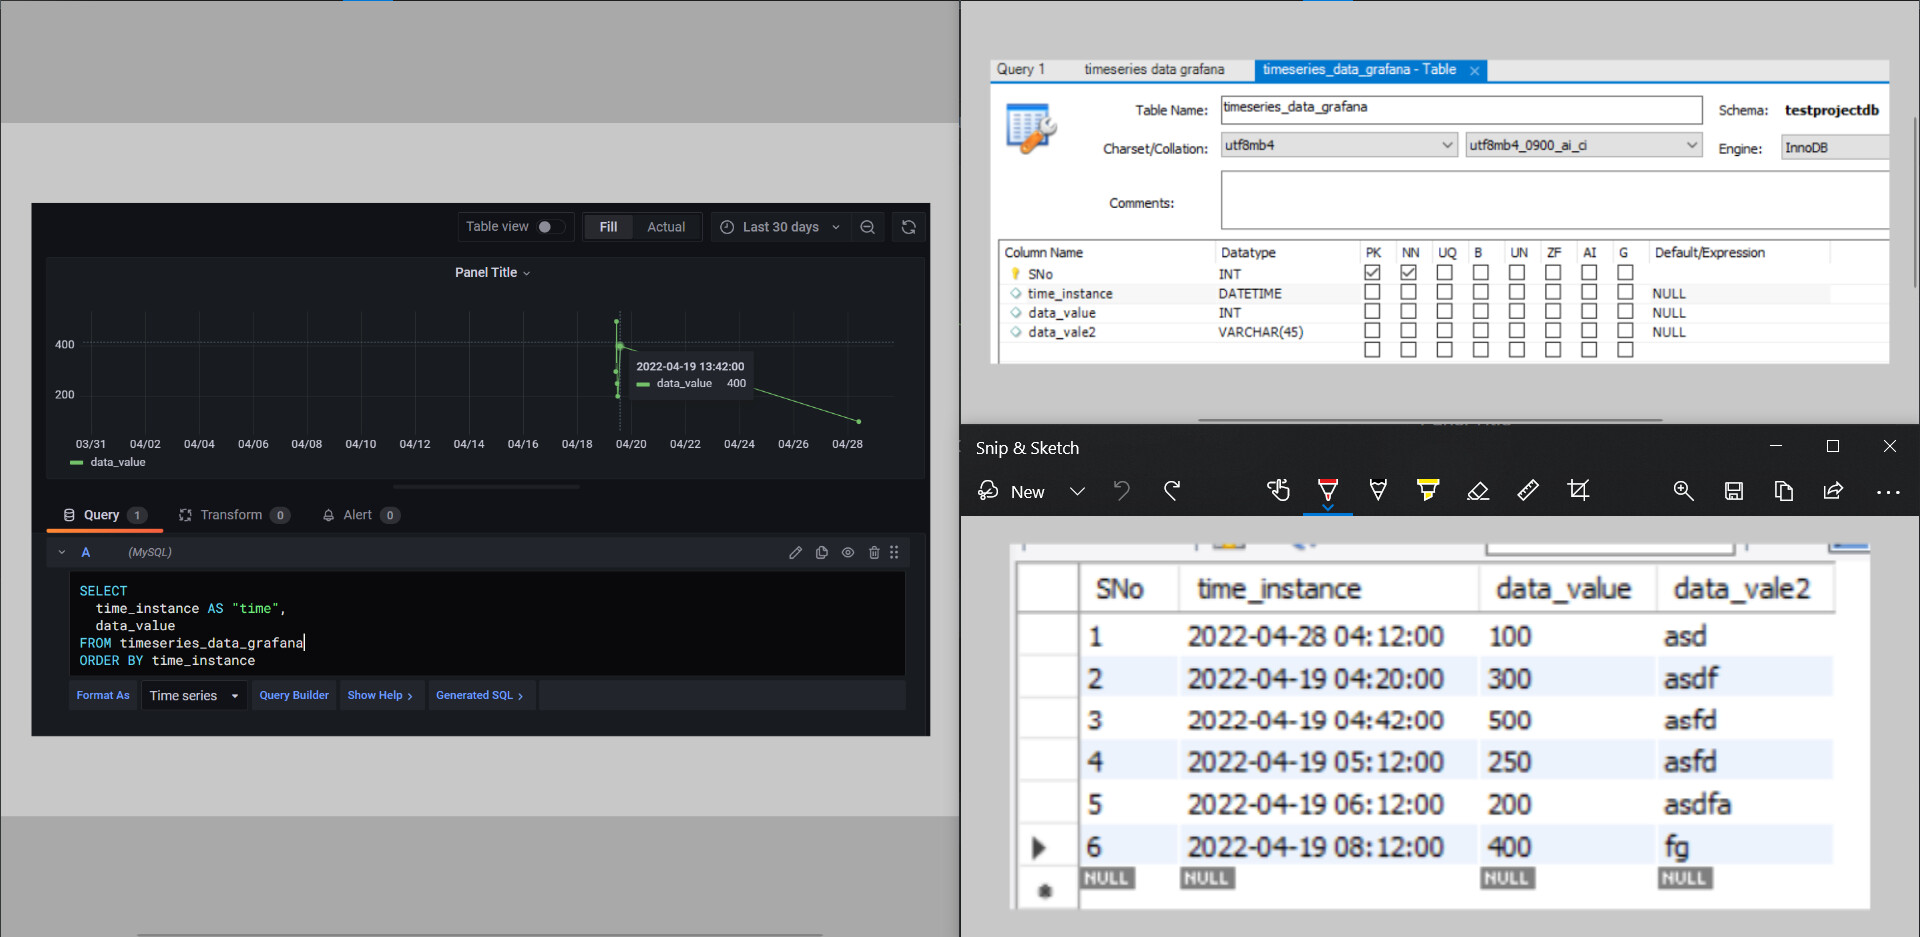
MySQL timeseries data not displayed correct
1920×937 230 KB
Timeseries data from MySQL database is having different values in grafana. I have attached the grafana dashboard, MySQL table schema and the table content.
Thanks in advance for any help.
yosiasz
April 29, 2022, 4:14pm
2
Check the last comment here, it might help
Related topics
Topic
Replies
Views
Activity
Time-series panel displays incorrect data
Dashboards
timestamp
,
visulazation
6
2918
November 2, 2022
Time Series shows different time from database
Time Series Panel
mysql
1
763
August 14, 2021
MySQL Time and Grafana Times are sync
Dashboards
1
169
December 18, 2023
Grafana + MySQL timezone issue
MySQL
mysql
7
17509
July 31, 2023
Help creating timeseries graph using mysql data
MySQL
mysql
,
time-series-panel
4
4382
January 9, 2022