I have a MariaDB (mysql) connection to Grafana. Right now it only has example data in the table that I use but it shouldn’t matter. I want a simple graph with timeaxis and value (kwh) axis. It was very simple with my connection with Influxdb but I can’t get it to work with the data coming from mysql.
If I switch to a table view the data is coming in and is being displayed:
The data is coming from two columns in mysql. “kwh” which is a decimal (5,2). “date” which is a “date” data-type. Note that it is only date and not date-time. Does that matter?
I have Grafana v8.3.3 running as an addon in Home Assistant supervisor OS.
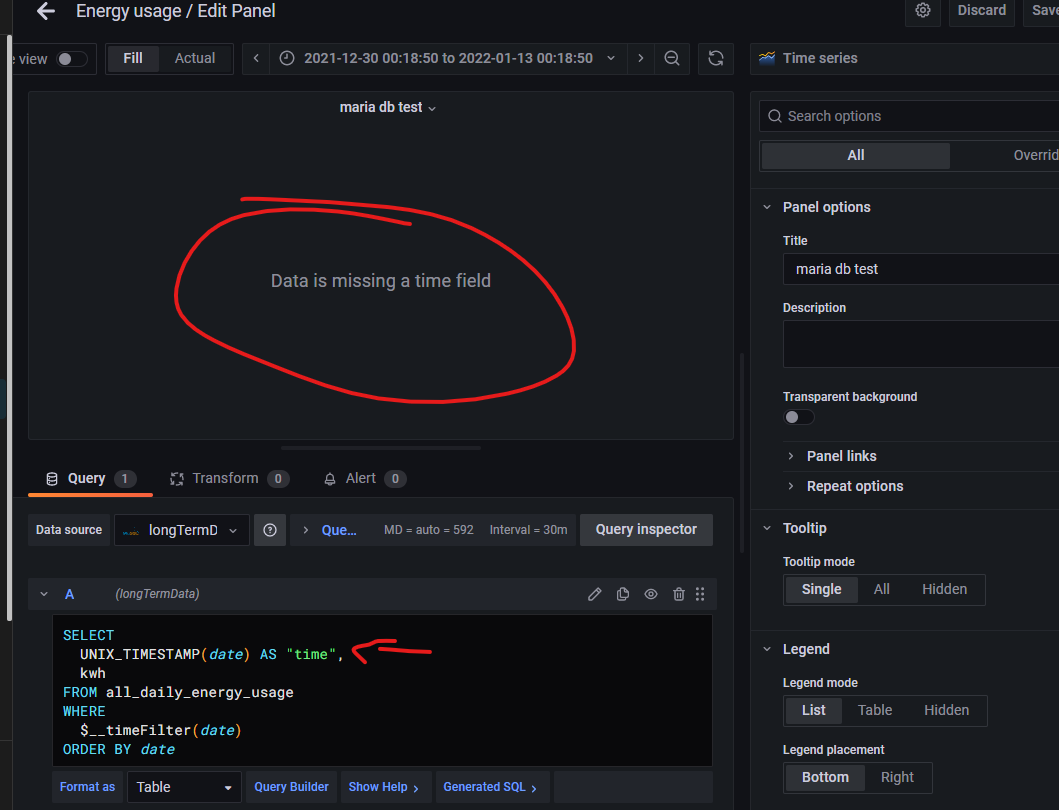
But when using this function in the timeline it then switches to saying that “Data is missing a time field”. If I remove the WHERE statement the error disappears but then I’m back with the view from the original post, that no data is being displayed in the graph.
Hi, thanks for the suggestion. I tried it and it didn’t make any difference. I thought I had missed something obvious but since it appears I haven’t I just started from the beginning again. Created a new table in mysql and instead change the columns to be called “dateSTAMP” and “value” and now it all works. Don’t ask me why but it could be because of occupied keywords so you cant use “date”. Anyway, thanks!