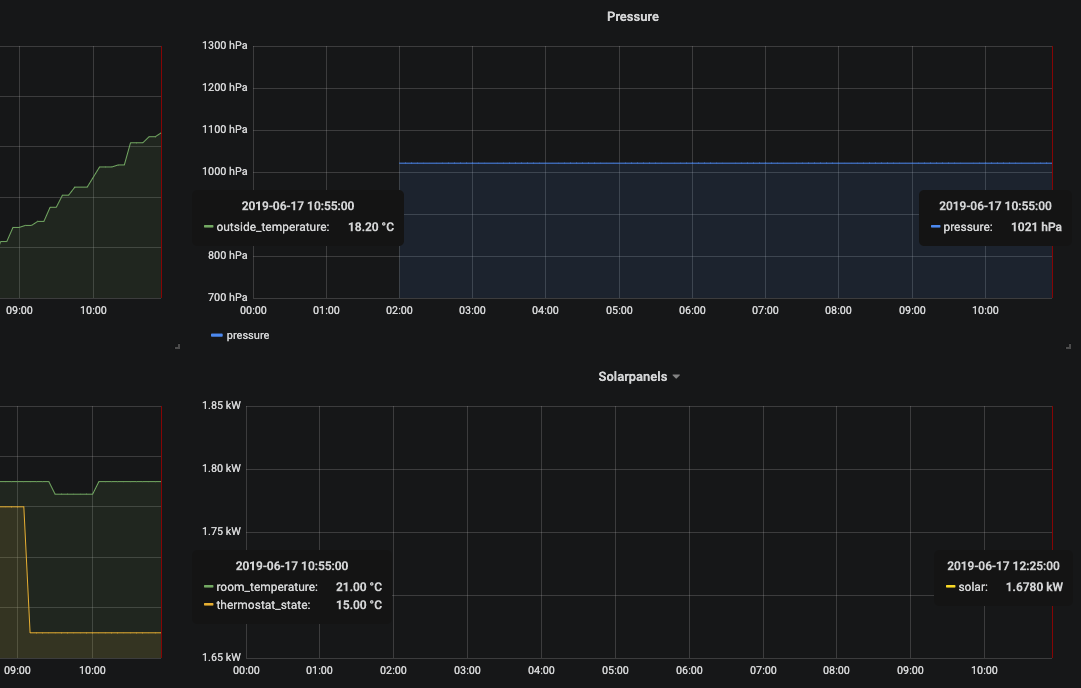
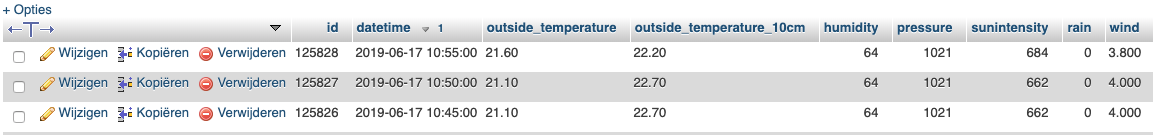
I can’t get my data to display in the right time. I’m not sure why, but I get a 2hour gap in the start of the graph, while the data is available in MySql:
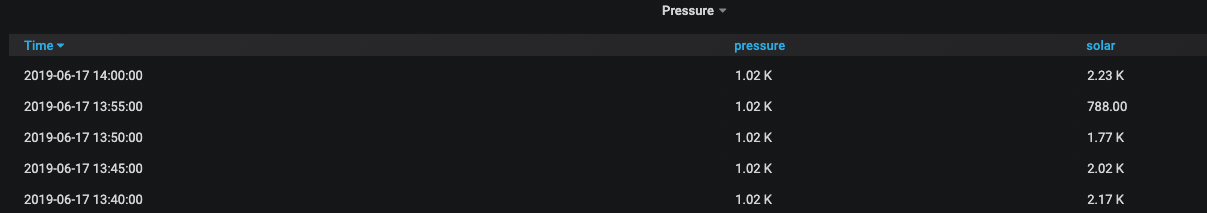
What also is very strange is that 2 graphs with exactly the same structure have different time offsets. As you can see the pressure graph latest datapoint is 10:55, while the solar latest datapoint is 12:25. In MySQL the times are exactly the same:
And the Solarpanel information is stored like this:
As you can see, the date & time are exactly the same, but in the graph the solar panels are 2 hours ahead!
I’ve changed the timezone in grafana several times (Defaul/local browser/UTC), but that doesn’t change anything.
The time on the grafana server (MySQL is also running on that server): Mon Jun 17 11:02:20 CEST 2019
The time on my laptop (browser time): ma 17 jun 2019 11:02:20 CEST (Dutch notation)
I’m using Grafana v6.2.2
I just can’t figure out what is going on. Can anyone help me?
Thanks!
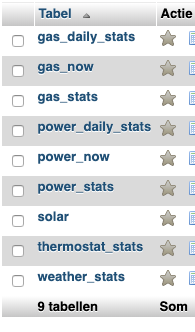
Are they in the same database?
Using the mysql command line run select * from weather_stats order by datetime desc limit 1
and select * from solar order by datetime desc limit 1
which will get you the latest samples from each one and check the timestamps.
Sounds like one field is a DATETIME, and one is a TIMESTAMP. From mysql manual " MySQL converts TIMESTAMP values from the current time zone to UTC for storage, and back from UTC to the current time zone for retrieval. (This does not occur for other types such as DATETIME .)"
There is issue in grafana where it checks time as UTC time but when in interval comparison or group by it checks time as local and only converting interval time to UNIX .
Solution - You should add one more column to table which should contains UNIX equivalent time of your timestamp and pass that in time column and everything will work.
Eg.
Local Browser Time - 2020-05-31 17:21:05 (It is UTC + 5:30)
UNIX_TIMESTAMP - 1590945665
I’m having the same issue where where I have a timeStamp column which is in fact in DATETIME format with the format “YYYY-MM-DD HH:MM:SS”
But changing the request like you did didn’t work for me. I’m in UTC-5:00, and when I choose UTC0, the time on the data is good , but obviously, I’m 5 hours into the future.
SO even though My timeStamp on the DB is 12:00:00, when I open the data on grafana it shows 7:00:00
SELECT
    timeStamp AS "time",
    pd1DigitalNumberMean
FROM DetectorUnitsData
WHERE
    UNIX_TIMESTAMP(timeStamp) AND
    unitID = '8'
ORDER BY timeStamp