Check this out for MSSQL
Thanks but I have kept read only permission to DB. Create function permission is denied. I want timefilter() to return local time or one which I select from dashboard’s time zone, but it’s not possible I see. It only returns UTC. My DB stores timestamp based on local time zone.
You can see this:
I am having this same issue. Data in my MySQL database is in UTC timezone in datetime data type format (YYYY-MM-DD HH:MM:SS):

The server is in PST(UTC-8:00):

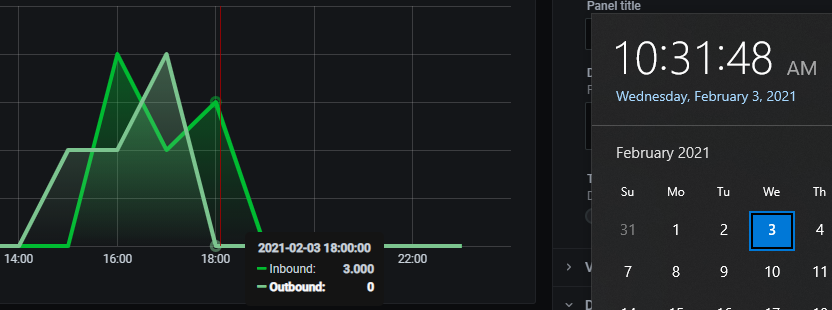
I have many queries that this is affecting. Previously Grafana was working as intended, but it seems to randomly decide to stop interpreting these as UTC and I am left with an offset of 8 hours. See below, the graphs are updating in real time and should only contain entries up to 10:00AM, however it shows as reading the datetimes as they are in UTC format, seemingly without doing any conversion. Note that in this screenshot, the time in Grafana is set to Browser (UTC-8:00). I do not understand why Grafana is no longer subtracting 8 hours from the time it is reading from the database. It should be interpreting the datetime as UTC, and subtracting 8 hours.
Here is one of my queries. $time_column is a custom variable I have set to equal the field seen above, time_start:
SELECT
  $__timeGroupAlias($time_column, $__interval, 0),
  count(*) as value,
  'Outbound' as metric
FROM $log_table
WHERE
  $__timeFilter($time_column)
  AND
  direction = 'OUT'
GROUP BY 1
ORDER BY $__timeGroup($time_column, $__interval, 0)
Using UNIX_TIMESTAMP() on my time column here results in the following error:
macro __timeGroup needs time column and interval
And does not resolve the issue.
The weirdest part is that has been working fine up until recently, the Grafana has been running in a production environment for about a week and was displaying correct values. No changes were made to the system, MySQL, Grafana server, or otherwise, yet this problem seems to appear out of nowhere.
Solved: