UTC to Local Time Zone Issue MySQL Data Source

Hi everyone, I’m running Grafana v7.3.7 (1e261642f4) and I’ve run into a frustrating issue regarding time data.

I am working on a project dealing with one MySQL database table which contains a few columns containing time data, all using the datetime data type. All entries into the time data columns are drawn from an external file, in UTC time zone format.

I am using only one of these columns in all my queries, titled time_end. Here is an example of one of my queries, which displays a bar graph at hourly intervals:

SELECT
  $__timeGroupAlias(time_end,'1h',0),
  count(*) as value,
  'Incoming' as metric
FROM $log_table
WHERE
  $__timeFilter(time_end)
  AND
  direction = 'IN'
GROUP BY 1
ORDER BY $__timeGroup(time_end,'1h')

The query is being refreshed each minute, and the data being entered into the database is also being updated each minute. Therefor, the most recent data should be from approximately 12:00pm PST, according to my local browser time, as Grafana is set to Local Browser Time, UTC-8:00.

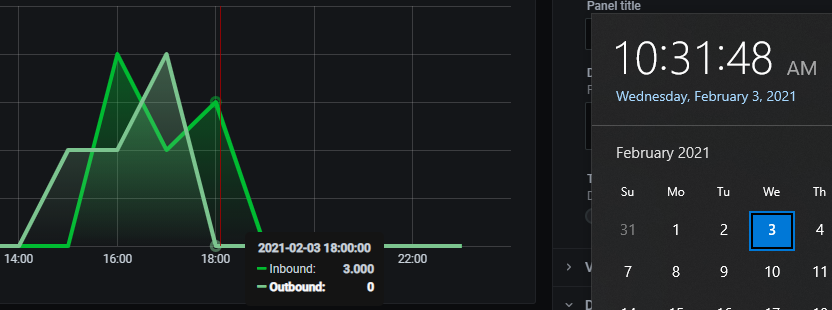
However, instead, this results in the following graph:

Which, as you can see, shows the most recent entry as 20:00, 8 hours into the future. For some reason, Grafana is not interpreting the UTC time codes within the MySQL database and converting them to PST.

I can provide any additional details if required, any help is appreciated!

Bump, I am having this issue again. I solved this issue last time by restarting my MySQL server, however this time this did not fix the problem. I am out of ideas. If anyone has any thoughts on this please let me know. Here is more information, posted in another thread as well:

Data in my MySQL database is in UTC timezone in datetime data type format (YYYY-MM-DD HH:MM:SS):

image

The server is in PST(UTC-8:00):

image

I have many queries that this is affecting. Previously Grafana was working as intended, but it seems to randomly decide to stop interpreting these as UTC and I am left with an offset of 8 hours. See below, the graphs are updating in real time and should only contain entries up to 10:00AM, however it shows as reading the datetimes as they are in UTC format, seemingly without doing any conversion. Note that in this screenshot, the time in Grafana is set to Browser (UTC-8:00). I do not understand why Grafana is no longer subtracting 8 hours from the time it is reading from the database. It should be interpreting the datetime as UTC, and subtracting 8 hours.

Here is one of my queries. $time_column is a custom variable I have set to equal the field seen above, time_start:

SELECT
  $__timeGroupAlias($time_column, $__interval, 0),
  count(*) as value,
  'Outbound' as metric
FROM $log_table
WHERE
  $__timeFilter($time_column)
  AND
  direction = 'OUT'
GROUP BY 1
ORDER BY $__timeGroup($time_column, $__interval, 0)

Using UNIX_TIMESTAMP() on my time column here results in the following error:
macro __timeGroup needs time column and interval

And does not resolve the issue.

The weirdest part is that has been working fine up until recently, the Grafana has been running in a production environment for about a week and was displaying correct values. No changes were made to the system, MySQL, Grafana server, or otherwise, yet this problem seems to appear out of nowhere.

There seems to be some problem with the macros $__timeGroup and $__timeGroupAlias, but I need to be using these as the graphs have to be dynamic and use the $__interval variable. I do not know how to implement the $__interval variable without using the macros. I am able to force the graphs to display correctly, by manually converting the time column to the correct timezone, however this means I cannot zoom into the graph and the data points remain static (no data points are added when I zoom in, or deleted when I zoom out):

SELECT
  UNIX_TIMESTAMP(CONVERT_TZ(time_start,'+00:00','-8:00')) DIV 3600 * 3600 AS "time",
  count(*) as value,
  'Outbound' as metric
FROM $log_table
WHERE
  $__timeFilter($time_column)
  AND
  direction = 'OUT'
GROUP BY 1
ORDER BY UNIX_TIMESTAMP(CONVERT_TZ(time_start,'+00:00','-8:00')) DIV 3600 * 3600

I shouldn’t have to do this - I have what I think is a fairly standard use case (although I am not using a time series database). UTC time data stored, Grafana should recognize that and be converting from UTC to whatever timezone is specified.

Alright so this is a little embarrassing, but it really shouldn’t be the solution. The server running MySQL and Grafana was set to PST time zone. Changing the system timezone to UTC solved all of the issues.

That being said - I don’t know why this is the case. It was functioning correctly when the server was set to PST time, and then it wasn’t. MySQL datetime is agnostic in terms of timezone, so whatever Grafana is receiving does not have time zone data applied to it. Grafana must be applying the system timezone to the data AFTER it retrieves it from the database, which I believe should not be the behavior and could even be classified as a bug. Grafana should interpret the data from the database as-is, and in my case it was UTC from the database.

Next time I’m using a time-series database, lol

1 Like

This topic was automatically closed after 365 days. New replies are no longer allowed.