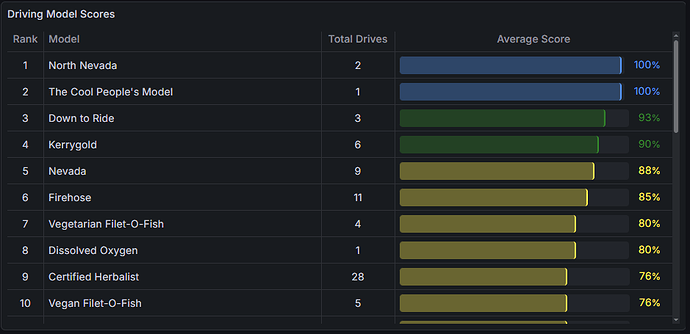
-
What Grafana version and what operating system are you using?
I’m using Grafana in a web browser (Grafana Cloud or hosted instance). I’m not sure about the exact version. -
What are you trying to achieve?
I’m trying to remove the weird opacity or faded effect from the gauge visualization that appears inside my table panel. -
How are you trying to achieve it?
I’ve been editing the visualization options directly in the Grafana web interface, adjusting colors, thresholds, and display settings for the gauge field. -
What happened?
The gauge appears semi-transparent or faded instead of showing a solid color. I can’t find any setting that controls the opacity. -
What did you expect to happen?
I expected the gauge to display with a solid, fully opaque color that matches my selected color scheme. -
Can you copy/paste the configuration(s) that you are having problems with?
I’m just using the default table panel with one column set to display as a gauge. I haven’t modified the JSON or dashboard configuration directly. -
Did you receive any errors in the Grafana UI or in related logs? If so, please tell us exactly what they were.
No errors in the UI or logs, it’s just a visual issue. -
Did you follow any online instructions? If so, what is the URL?
No, I haven’t followed any specific guides yet. I’ve just been exploring the visualization settings in the Grafana interface.
Essentially I’m trying to make the colors in my gauge:
not look all washed out and have the full vibrant colors.

