Hi,
We have a running setup with a K3S Cluster, Telegraf for metrics pushed to mqtt and Grafana to show these metrics. We don’t need historical data, so we do not have a InfluxDB installed.
Our problem is, that we can see the JSON messages in Grafana, but we have no clue how to parse them and show them in a dashboard.
MQTT message (e.g. memory):
{
"fields":{
"active":442454016,
"available":2941112320,
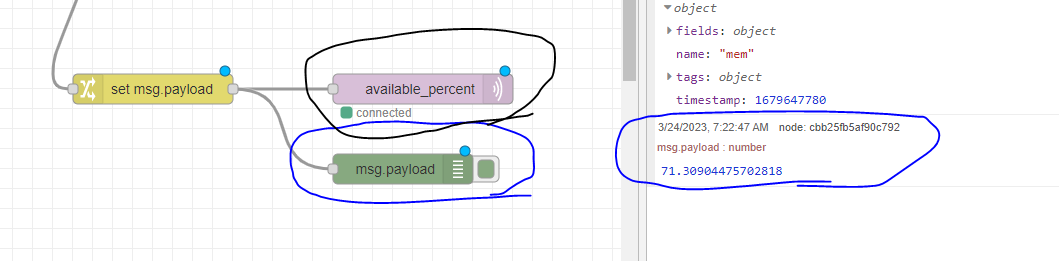
"available_percent":71.30904475702818,
"buffered":46247936,
"cached":1229934592,
"commit_limit":2062229504,
"committed_as":1570803712,
"dirty":24576,
"free":1897500672,
"high_free":0,
"high_total":0,
"huge_page_size":2097152,
"huge_pages_free":0,
"huge_pages_total":0,
"inactive":1673703424,
"low_free":0,
"low_total":0,
"mapped":414302208,
"page_tables":4644864,
"shared":1703936,
"slab":72286208,
"sreclaimable":41578496,
"sunreclaim":30707712,
"swap_cached":0,
"swap_free":0,
"swap_total":0,
"total":4124459008,
"used":950775808,
"used_percent":23.052133774534536,
"vmalloc_chunk":0,
"vmalloc_total":35184372087808,
"vmalloc_used":12550144,
"write_back":0,
"write_back_tmp":0
},
"name":"mem",
"tags":{
"host":"vo-node-1"
},
"timestamp":1679647780
}

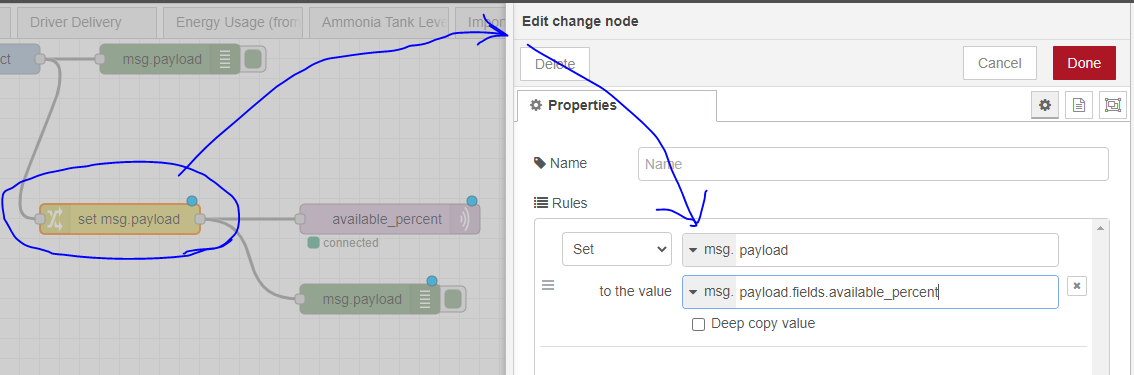
As you can see, Grafana gets all the information from the message and if we use this query as a base for a Time Series Dashboard, it will only show the value of “timestamp”.
But we want to show the value for “available_percent” for example and in the next step, show this percentage value for all of our four K3S nodes.
Any help is much appreciated ![]()
Markus