Same Value Updating in Time Series

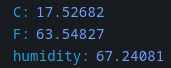
I’m trying to create a graph of the temperature throughout the day from a microcontroller with Grafana, but noticed that Grafana isn’t graphing anything, it’s actually just updating the same value whenever requested:


The value above is just being changed over and over again, making the graph a single dot.
How would I go by fixing this?

Thanks.

It would help if we knew your

Grafana version
Data source

And that image is impossible to see

I’m on version 9.3.2
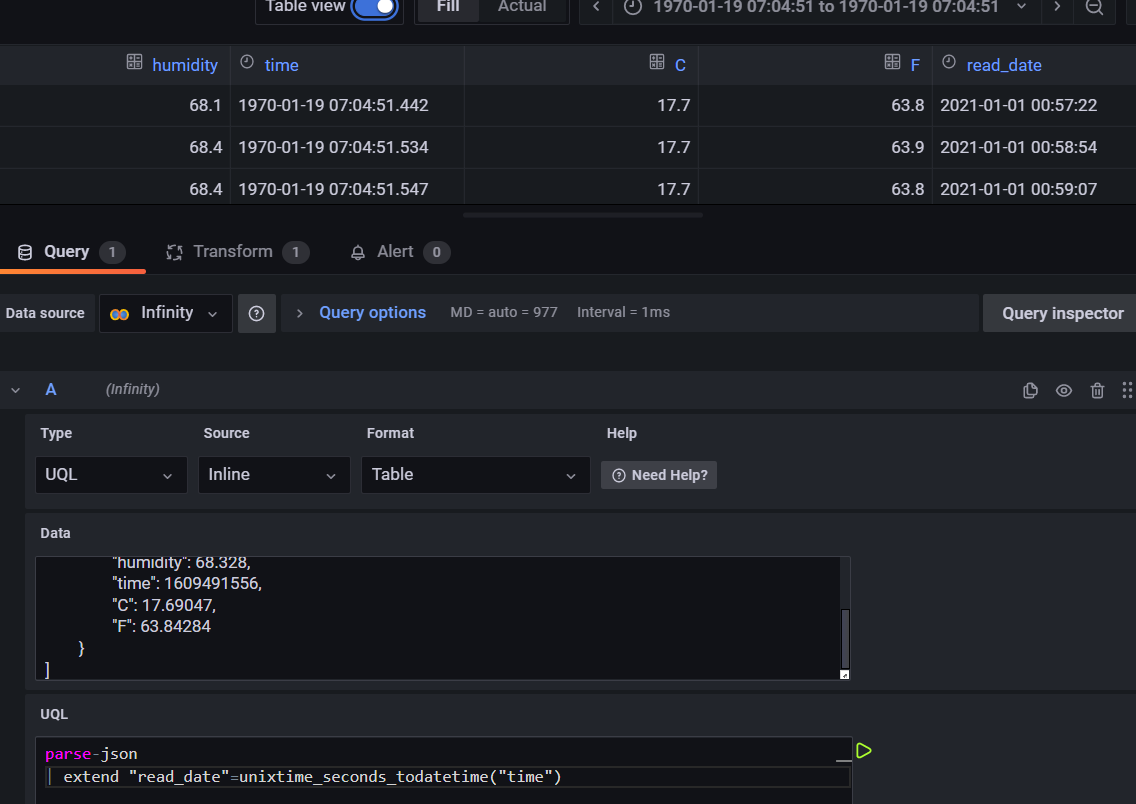
My data source is the infinity plugin receiving JSON from a Pico W Webserver:
image
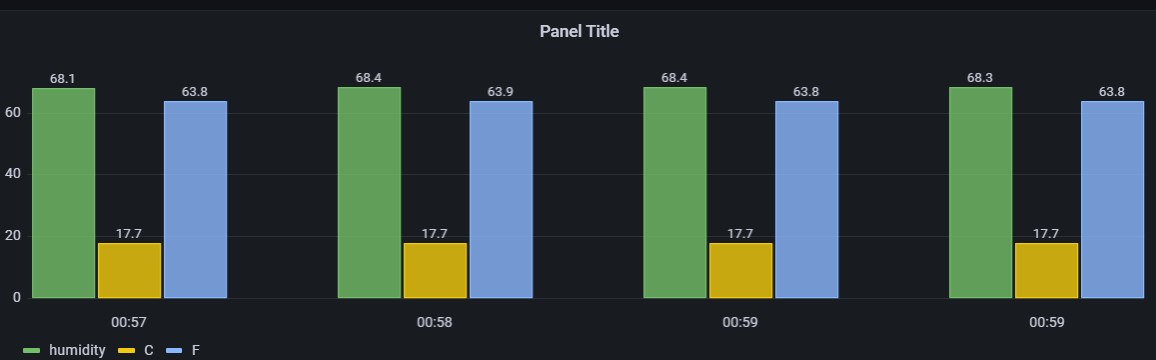
It works fine with the stats panel, but the graph isn’t graphing.

Please post sample json data inline?
Not as an image then we can test it on our grafana

Sure.

{"humidity": 68.05945, "time": 1609491442, "C": 17.67502, "F": 63.81503}
{"humidity": 68.42194, "time": 1609491534, "C": 17.69943, "F": 63.85898}
{"humidity": 68.36234, "time": 1609491547, "C": 17.69409, "F": 63.84937}
{"humidity": 68.328, "time": 1609491556, "C": 17.69047, "F": 63.84284}

(Note that I am not using the time attribute because it thought it was 2020)

1 Like

use UQL to convert that date.

1 Like

Hi, this works! I noticed the data is in a list. I’m receiving live data from a sensor. Would it be possible to add this data that is coming in to the list so it can be graphed?

1 Like

We dont have access to your api hence the list. Just plugin your api url

1 Like

Is there a specific JSON format I should use for Grafana to read it? Right now it just returns the JSON I sent earlier.

It just has to be a valid json format, not a specific format. The json you posted would not qualify as valid json format unless some of the formatting got lost when you posted it