Hi!
I’m getting this error of the image below when trying to get a CPU utilization graph with data coming from a Zabbix instance for a period of 7 days.
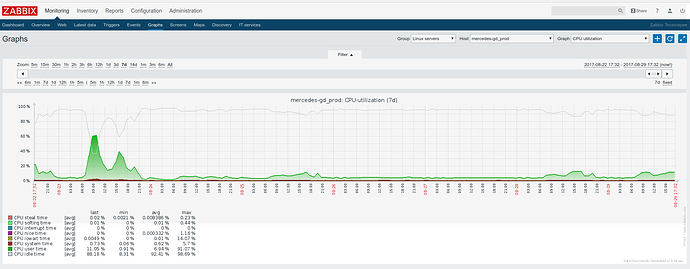
The same graph generated in Zabbix is OK as you can see below:
Please can you help me with this? I believe this is a bug on Grafana. I’m using the 4.4.3 Grafana version:
grafana-server -v
Version 4.4.3 (commit: 54c79c5)
torkel
2
Looks like zabbix is returning un-ordered time series. Can you check the raw response from your zabbix query (open chrome dev tools network tab)
Hi, @torkel!
I solved the problem yesterday updating my Grafana Zabbix App plugin to version 3.6.1 with the command below:
root@zabbix-prod:/etc/grafana# grafana-cli plugins update alexanderzobnin-zabbix-app
Removing plugin: alexanderzobnin-zabbix-app
installing alexanderzobnin-zabbix-app @ 3.6.1
from url: https://grafana.com/api/plugins/alexanderzobnin-zabbix-app/versions/3.6.1/download
into: /var/lib/grafana/plugins
✔ Installed alexanderzobnin-zabbix-app successfully
Restart grafana after installing plugins . <service grafana-server restart>

root@zabbix-prod:/etc/grafana# service grafana-server restart
 * Stopping Grafana Server                                                                                                                   [ OK ]
 * Starting Grafana Server                                                                                                                     [ OK ]

