Hello guys,
I have a question i have currently a zabbix monitoring system but i want to extend it with grafana.
Now when i monitor with grafana the cpu usage in procent around 2931000000.
And when i look in zabbix it’s good.
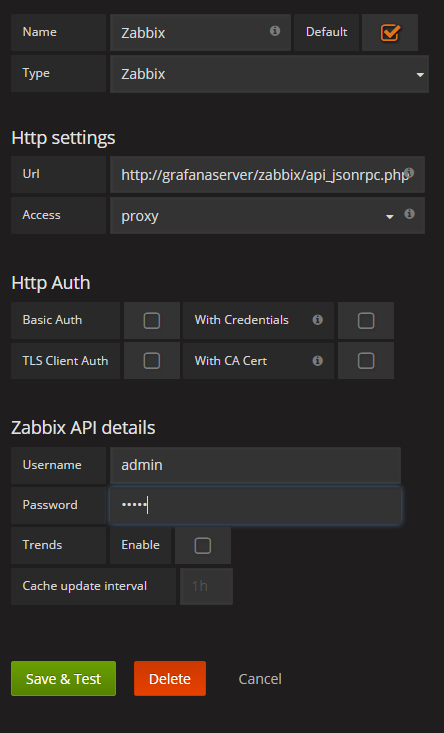
Can someone help me with this. Here are some pictures of my configuration.

Hello! Can you show your singlestat panel options? You use regex in item name, so Zabbix returns multiple series. Singlestat panel support only one series, so if you want to show total cpu time for all types (user, system, iowait, …) you should use sumSeries() function:
1 Like
i’ve tried to use the sumseries functions but it’s still to high.
And here is the picture of the options.
Can you try to create the same metric with a Graph panel? Can you also try to look at zabbix api response in dev tools?
when i create a graph panel with the same metric it’s still to high.
And where can i vind the dev tools ?
Often F12 or ctrl+shift+I in Chrome. Tab network
As you can see, Zabbix API returns wrong value. Can you confirm that itemid is correct (when you see item in zabbix, you can find itemid in url string)?
Looks like he had a differend itemid
No, you see graph id (and different metrics - Processor load, not cpu time), can you create graph in zabbix from Latest data page? Or just hover mouse over Graph link and look at url:
Anyway it looks like zabbix api returns value multiplied by one million.
Grafana wants to monitor the wrong cpu usage it wants to monitor the ghz. Where can i edit this settings.
And if i want to monitor the memmory i have the same problem.
It works fine now. Thank you for your help