I am using a lot of overrides in different panels, and some panels have the same field name and same override repeated on each panel.
It is very time consuming to maintain the same overrides in each panel of the same dashboard.
Is there a way to add overrides at dashboard level that would apply on all fields with the same name inside the dashboard?
Though I am not 100% sure but I think I know what you mean.
So let’s suppose that you created an IOT Dashboard where you created different panels for different devices.
Each panel have a different set of overrides applied.
One way could be to use those again by simply duplicating that panel and just modify the settings
Another way would be to use it as Dashboard by selecting the Dashboard as Datasource. This way you can select the same panel and only need to modify any new settings as required.
Here is a demo GIF
If this is not the answer you are looking for, then kindly let us know
Hey there,
Thanks for the tip, I should look if this applies but tbh that would be a pain to remake all the dashboard by duplicating panels.
Here is my case so you can understand better: I build this dashboard to monitor nodes Polkadot and parachains full monitoring | Grafana Labs
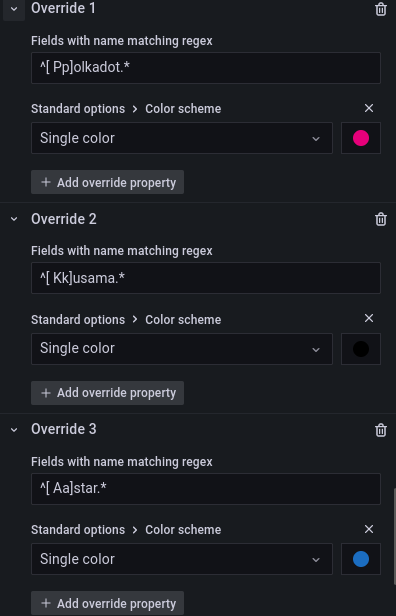
Each node is labelled “chain” and I am applying a color override to most of the pannels individually:
But I have to maintain overrides regularly by adding new values, meaning I have to update the json manually each time.
Having an option to apply overrides at the dashboard level (in the settings for example) would be a very useful option.
Hello @usman.ahmad
I am trying to override some fields in a panel, but instead of getting the server names, the results are being shown. I have posted the details here. Everything is working fine on my other instance of Grafana but it is an older version (10.0.1).