Merge up status and instance_name panel

  • What Grafana version and what operating system are you using?

    Grafana v12.2.1 (563109b696)

  • What are you trying to achieve?
    I am trying to merge the results of 2 prometheus metrics, up and server_name into one panel per node.The panel should include both the server name and ip address. The panel should be green if the node is up and red if the node is down.

  • How are you trying to achieve it?
    I have tried joining by field, but there is no option to select the instance ip address, a value both queries have in common.

  • What happened?
    The server_name is in a different panel to the one holding the ip address and up status.

  • What did you expect to happen?
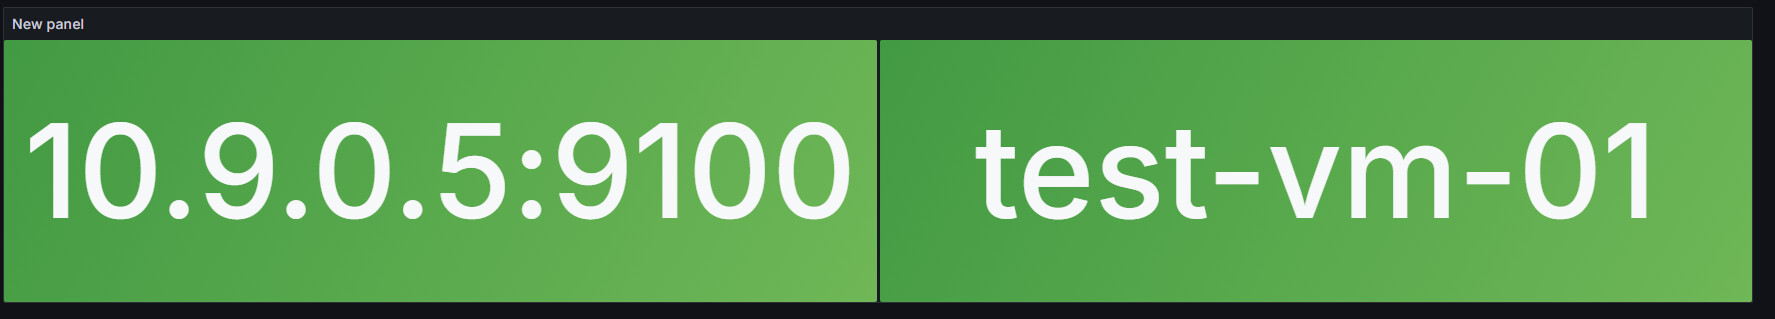
    For there to be a single panel to represent the node, containing both the name, ip address and colour reflecting the up status as pictured in this photoshopped output below.

  • Can you copy/paste the configuration(s) that you are having problems with?
    Panel JSON:

{
  "id": 1,
  "type": "stat",
  "title": "New panel",
  "gridPos": {
    "x": 0,
    "y": 0,
    "h": 8,
    "w": 12
  },
  "fieldConfig": {
    "defaults": {
      "mappings": [],
      "thresholds": {
        "mode": "absolute",
        "steps": [
          {
            "color": "green",
            "value": null
          },
          {
            "color": "red",
            "value": 80
          }
        ]
      },
      "unit": "short"
    },
    "overrides": []
  },
  "transformations": [
    {
      "id": "joinByField",
      "options": {
        "byField": "Time",
        "mode": "outerTabular"
      }
    }
  ],
  "pluginVersion": "12.2.1",
  "targets": [
    {
      "datasource": {
        "type": "prometheus",
        "uid": "ff33tt81bqs5cc"
      },
      "editorMode": "builder",
      "expr": "up",
      "legendFormat": "{{instance}}",
      "range": true,
      "refId": "A"
    },
    {
      "datasource": {
        "type": "prometheus",
        "uid": "ff33tt81bqs5cc"
      },
      "editorMode": "builder",
      "expr": "server_name",
      "hide": false,
      "instant": false,
      "legendFormat": "{{instance_name}}",
      "range": true,
      "refId": "B"
    }
  ],
  "datasource": {
    "type": "prometheus",
    "uid": "ff33tt81bqs5cc"
  },
  "options": {
    "reduceOptions": {
      "values": false,
      "calcs": [
        "lastNotNull"
      ],
      "fields": ""
    },
    "orientation": "auto",
    "textMode": "name",
    "wideLayout": true,
    "colorMode": "background",
    "graphMode": "none",
    "justifyMode": "auto",
    "showPercentChange": false,
    "percentChangeColorMode": "standard"
  }
}

One possible way is using the new public preview SQL Expression

using the query below, I am able to see the desired data in 1 row.

SELECT concat(B.instance_name, ' (', B.instance, ')') as combined, A.__value__ FROM B,A

My panel seems to successfully read the __value__, but not combined as it does not show up properly in the panel.

What must I change the display name to in order to correctly show the value of combined? Additionally, I need to hide the value (in this case 1)

Updated Panel JSON

{
  "id": 1,
  "type": "stat",
  "title": "New panel",
  "gridPos": {
    "x": 0,
    "y": 0,
    "h": 8,
    "w": 12
  },
  "fieldConfig": {
    "defaults": {
      "mappings": [
        {
          "options": {
            "{{__value__}}": {
              "index": 0
            }
          },
          "type": "value"
        }
      ],
      "thresholds": {
        "mode": "absolute",
        "steps": [
          {
            "color": "green",
            "value": null
          },
          {
            "color": "red",
            "value": 80
          }
        ]
      },
      "displayName": "{{combined}}",
      "unit": "short"
    },
    "overrides": []
  },
  "pluginVersion": "12.2.1",
  "targets": [
    {
      "datasource": {
        "type": "prometheus",
        "uid": "df3t6x2p9reo0e"
      },
      "editorMode": "builder",
      "expr": "up",
      "hide": true,
      "legendFormat": "__auto",
      "range": true,
      "refId": "A"
    },
    {
      "datasource": {
        "type": "prometheus",
        "uid": "df3t6x2p9reo0e"
      },
      "editorMode": "builder",
      "expr": "server_name",
      "hide": true,
      "instant": false,
      "legendFormat": "__auto",
      "range": true,
      "refId": "B"
    },
    {
      "datasource": {
        "name": "Expression",
        "type": "__expr__",
        "uid": "__expr__"
      },
      "expression": "SELECT concat(B.instance_name, ' (', B.instance, ')') as combined, A.__value__ FROM B,A\n\n-- SELECT * FROM",
      "hide": false,
      "refId": "D",
      "type": "sql"
    }
  ],
  "datasource": {
    "type": "prometheus",
    "uid": "df3t6x2p9reo0e"
  },
  "options": {
    "reduceOptions": {
      "values": false,
      "calcs": [
        "lastNotNull"
      ],
      "fields": ""
    },
    "orientation": "auto",
    "textMode": "auto",
    "wideLayout": true,
    "colorMode": "background",
    "graphMode": "none",
    "justifyMode": "center",
    "showPercentChange": false,
    "percentChangeColorMode": "standard",
    "text": {
      "valueSize": 30,
      "titleSize": 40
    }
  }
}

I have since managed to hide the value. I now just need the display name to show up correctly.

Panel JSON

{
  "id": 1,
  "type": "stat",
  "title": "New panel",
  "gridPos": {
    "x": 0,
    "y": 0,
    "h": 8,
    "w": 12
  },
  "fieldConfig": {
    "defaults": {
      "mappings": [
        {
          "options": {
            "{{__value__}}": {
              "index": 0
            }
          },
          "type": "value"
        }
      ],
      "thresholds": {
        "mode": "absolute",
        "steps": [
          {
            "color": "green",
            "value": null
          },
          {
            "color": "red",
            "value": 80
          }
        ]
      },
      "displayName": "{{combined}}",
      "unit": "short"
    },
    "overrides": []
  },
  "pluginVersion": "12.2.1",
  "targets": [
    {
      "datasource": {
        "type": "prometheus",
        "uid": "df3t6x2p9reo0e"
      },
      "editorMode": "builder",
      "expr": "up",
      "hide": true,
      "legendFormat": "__auto",
      "range": true,
      "refId": "A"
    },
    {
      "datasource": {
        "type": "prometheus",
        "uid": "df3t6x2p9reo0e"
      },
      "editorMode": "builder",
      "expr": "server_name",
      "hide": true,
      "instant": false,
      "legendFormat": "__auto",
      "range": true,
      "refId": "B"
    },
    {
      "datasource": {
        "name": "Expression",
        "type": "__expr__",
        "uid": "__expr__"
      },
      "expression": "SELECT concat(B.instance_name, ' (', B.instance, ')') as combined, A.__value__ FROM B,A\n\n-- SELECT * FROM",
      "hide": false,
      "refId": "D",
      "type": "sql"
    }
  ],
  "datasource": {
    "type": "prometheus",
    "uid": "df3t6x2p9reo0e"
  },
  "options": {
    "reduceOptions": {
      "values": false,
      "calcs": [
        "lastNotNull"
      ],
      "fields": ""
    },
    "orientation": "auto",
    "textMode": "name",
    "wideLayout": true,
    "colorMode": "background",
    "graphMode": "none",
    "justifyMode": "center",
    "showPercentChange": false,
    "percentChangeColorMode": "standard",
    "text": {
      "titleSize": 20
    }
  }
}

A bit of different approach, but have you tried using joins (build in promql)? Something like:

up{} * on(<common_label_name>) server_name{}?

(If the common label is not named the same (e.g. in metric up it’s ip and in metric server_name it’s ip_address you can rename the label by using label_replace function).

Then you can use label_join function to get the single label.

where does the {{ }} come from?

Doing {{__value__}} worked for the value mapping so I was hoping that doing {{combined}} would have worked for displaying the value of combined

another issue I have just noticed is that if I take my test node offline, running the SQL expression causes this error.

On Prometheus, if i run the query server_name I no longer get any results which I presume is because the node is no longer there to respond with its name.

Going back to promql as suggested by @dawiddebowski, I have managed to get the panel to display the name and ip address. This is very close to what I am aiming for.

This was done using the query

label_replace(
  up + on(instance) group_left(instance_name) (server_name * 0),
  "ip", "$1", "instance", "(.*):.*"
)

However there is an issue where the panel colour does not update to red when I take a node offline.

In the image above, I have taken test-vm-02 offline, but the panel remains green.

running the query on Prometheus only provides a value for the online test-vm-01

What adjustments can I make to ensure that it both updates the panel to red when the node goes offline as well as remembers the server_name from when it was online?

Panel JSON

{
  "id": 1,
  "type": "stat",
  "title": "Node Status",
  "gridPos": {
    "x": 0,
    "y": 0,
    "h": 8,
    "w": 12
  },
  "fieldConfig": {
    "defaults": {
      "mappings": [],
      "thresholds": {
        "mode": "absolute",
        "steps": [
          {
            "color": "red",
            "value": null
          },
          {
            "color": "green",
            "value": 1
          }
        ]
      },
      "unit": "short"
    },
    "overrides": []
  },
  "pluginVersion": "12.2.1",
  "targets": [
    {
      "datasource": {
        "type": "prometheus",
        "uid": "ff33tt81bqs5cc"
      },
      "editorMode": "code",
      "expr": "label_replace(\n  up + on(instance) group_left(instance_name) (server_name * 0),\n  \"ip\", \"$1\", \"instance\", \"(.*):.*\"\n)",
      "legendFormat": "{{instance_name}} ({{ip}})",
      "range": true,
      "refId": "A"
    }
  ],
  "datasource": {
    "type": "prometheus",
    "uid": "df3t6x2p9reo0e"
  },
  "options": {
    "reduceOptions": {
      "values": false,
      "calcs": [
        "lastNotNull"
      ],
      "fields": ""
    },
    "orientation": "auto",
    "textMode": "name",
    "wideLayout": true,
    "colorMode": "background",
    "graphMode": "none",
    "justifyMode": "auto",
    "showPercentChange": false,
    "percentChangeColorMode": "standard"
  }
}

The two instances are shown because of the Range type set in the query options (next to the legend). When you use it, it provides all the points in the range. Notice that most probably when you turned off the second vm, the metric server_name wasn’t exposed anymore. Since there were no results on the right side of the join, PromQL dropped the result for the second vm (an article on how it works). When you change to the Time Series visualization, you’ll probably notice that the series for vm-01 is continous, while there are no points for vm-02 in the timestamps when the vm was down.

What you’d most probably want to do is setting the Type to Instant query - then only the last point will be taken into account. But then you won’t get the information about vm-02. To keep it, you should wrap server_name in last_over_time function - something like last_over_time(server_name[$__range]) - it will keep the last point from the server_name metric and should allow you to still have the result - as long as it’s in selected time range of the dashboard (e.g. if you select 6 hours and the vm-02 is down for 3 hours, you’ll see the vm, if it’s down for 12 hours, you probably won’t see it).