nEED answers for the below questions?
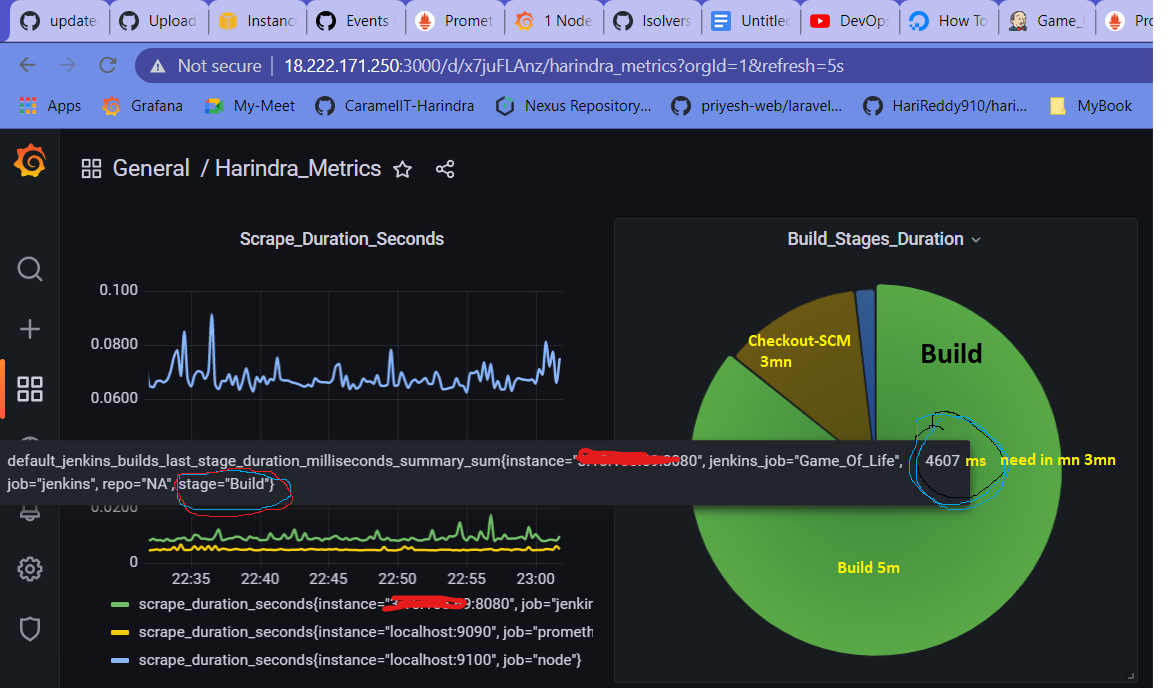
- 4607 ms how we can convert into Minutes
- I have multiple stages like CheckOut-SCM and ArchieveArtfacts include Build also one of the stages. when I move to cursor on the Green color it shows the length long name, how we can rename it just Build, instead of the entire name showing in the above Image.
exam below image the output I’m Expecting
welcome to the  forum, @harindra48
- https://grafana.com/docs/grafana/next/panels/standard-options/#unit
- might be useful to the community if you showed us the pie chart panel using the
table view feature
Hi, 6 months back I launched Jenkins Prometheus Grafana Docker containers and created Graphs in Grafana, you can see the above image in the stage=Build. But recently I launched 3 docker containers Jenkins Grafana Prometheus and tried to make graphs but I’m unable to fetch the stages names of the Jenkins pipeline, can someone help me to fetch the stage name.