Grafana 11.4
Data source Zabbix 7.2
I have a stat panel that collects multiple metrics from its data-source. It’s query option uses a 24h relative time.
I use this main panel as a source for other panels, each of which has transformations (as seeing in this topic).
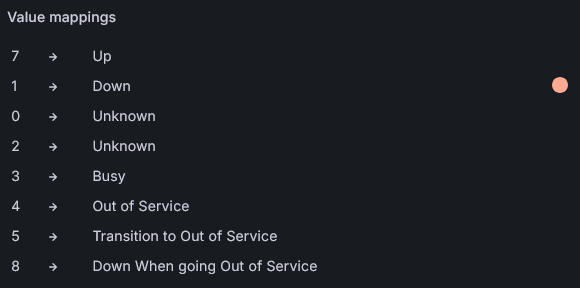
One of these secondary stat panels displays some float values, but it should only display mapped integer values.
This panel should show the latest service status value, which ranges from 0 to 8.
When I look at the source values in Zabbix, I can see they are correct: all integers with a 1h interval, if not changed.
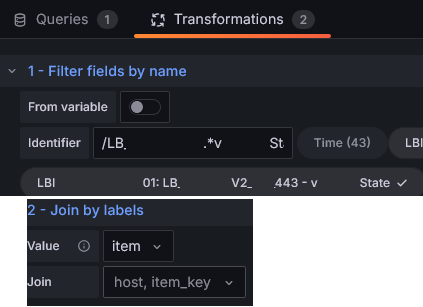
However, as shown above, the data displayed in Grafana is incorrect. The only transformations applied are Filter fields by name and Join by labels.
So, it seems Grafana is performing some kind of calculation, but I cannot determine what it is.
Please, any thoughts about this?
Hello @markfree,
After analyzing the issue, I believe I have identified the underlying problem. Please find below the recommended steps that may help resolve it
i will implement it using postgres
Step 1. Create a table and insert data
CREATE TABLE service_status (
    id SERIAL PRIMARY KEY,
    service_name TEXT NOT NULL,
    status INTEGER NOT NULL,
    timestamp TIMESTAMP WITHOUT TIME ZONE DEFAULT now()
);
INSERT INTO service_status (service_name, status, timestamp) VALUES
('LBI01', 4.5, '2025-08-07 10:00:00'),
('LBI01', 6.25, '2025-08-07 11:00:00'),
('LBI02', 2.7, '2025-08-07 10:15:00'),
('LBI03', 3.3, '2025-08-07 11:30:00');
Step 2. Add variable that filter the status based on service.
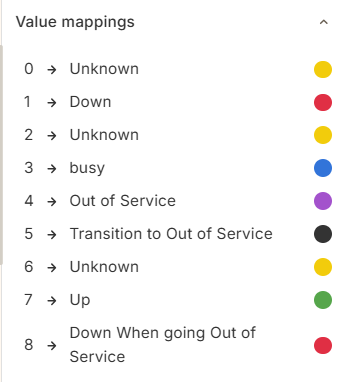
Step 3. Add Value mapping in stat panel
Step 4. Add a panel query that use Variable
SELECT
  service_name,
  ROUND(status) AS rounded_status
FROM
  service_status
WHERE
  service_name = '$service';
Final Output :
Thank you!
hello @infofcc3
so what do you believe is the underlying issue that OP’s zabbix datasource is coming out as float in grafana when it is not float in zabbix?
1 Like