We installed “Status panel” plugin to monitor the 200 servers.
We added the query which contacts InfluxDB and fetches the data.
The query at Grafana panel looks like:
FROM default stats WHERE host =~ /^$Host$/
SELECT field (stat1) mean ()
GROUP BY time ($__interval) fill (null)
FORMAT AS
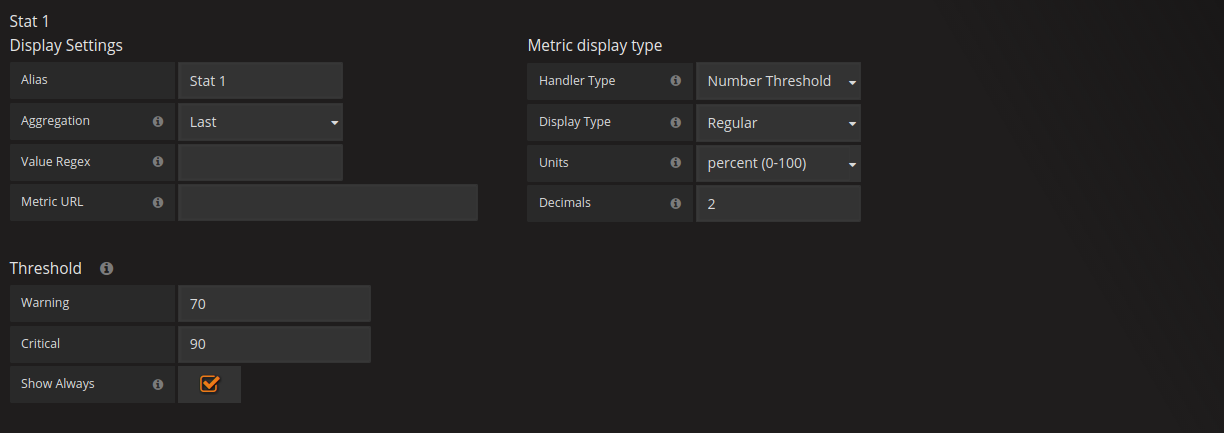
ALIAS BY Stat 1
We get the data in the format of percentages like 12.34, 0.45, 99.05 etc.,
Now the issue is:
We entered the number threshold values(critical and warning) at “options” of the status panel. But on the stats board it is showing “Invalid number” for the given stats.
In below image, we can observe the Invalid number error.
Hi @torkel
My query returns the values in float format like 12.34, 43.89, 97.67 etc.,
Now, we modified the aggregation parameter from Last to Avg. Now it is showing the numbers.
What does the Avg mean ?.
How can we see the latest incoming metrics to visualize, since we have changed the Last to Avg ? and how can I know that the metric is coming from which server?.