drex
1
Hi,
I have data in csv files from wifi tests and I would like to plot the graph but how to do this in grafana ?
I load data:
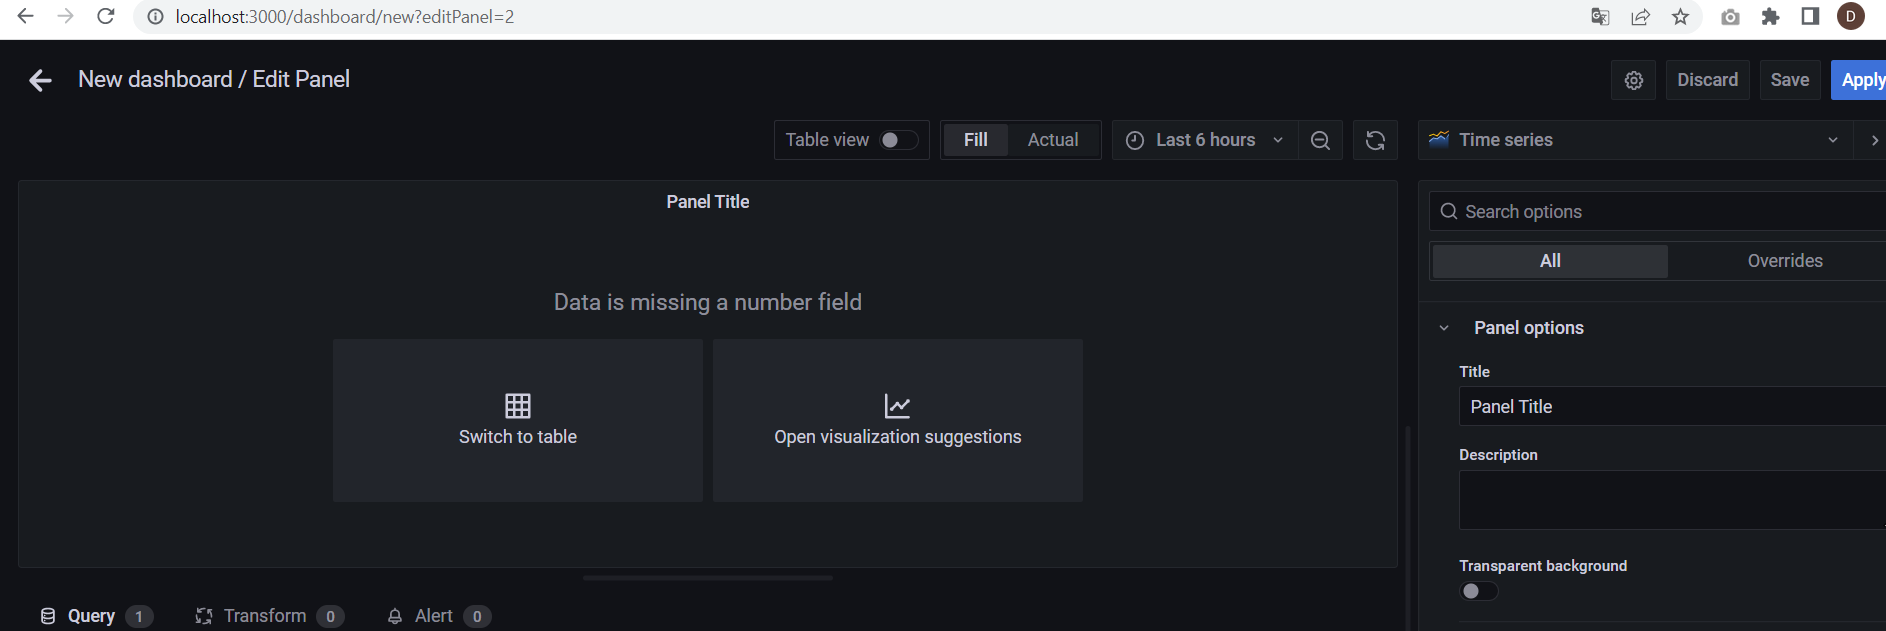
but I can only switch to table
So how to define the “x” like time and “y” as data from table for ploting a graph ?
I try… but no success
The Time field is set as a string (see in your screenshot). Try changing its type to time
drex
3
I think I found how, but some times don’t work…
data are the same
when it works I see time stamp (date, time)
In your screenshot it seems like the Time field is still treated as a string. Change it to date/time from the dropdown