Hi, I’m using Grafana 8.0 to visualize my data.
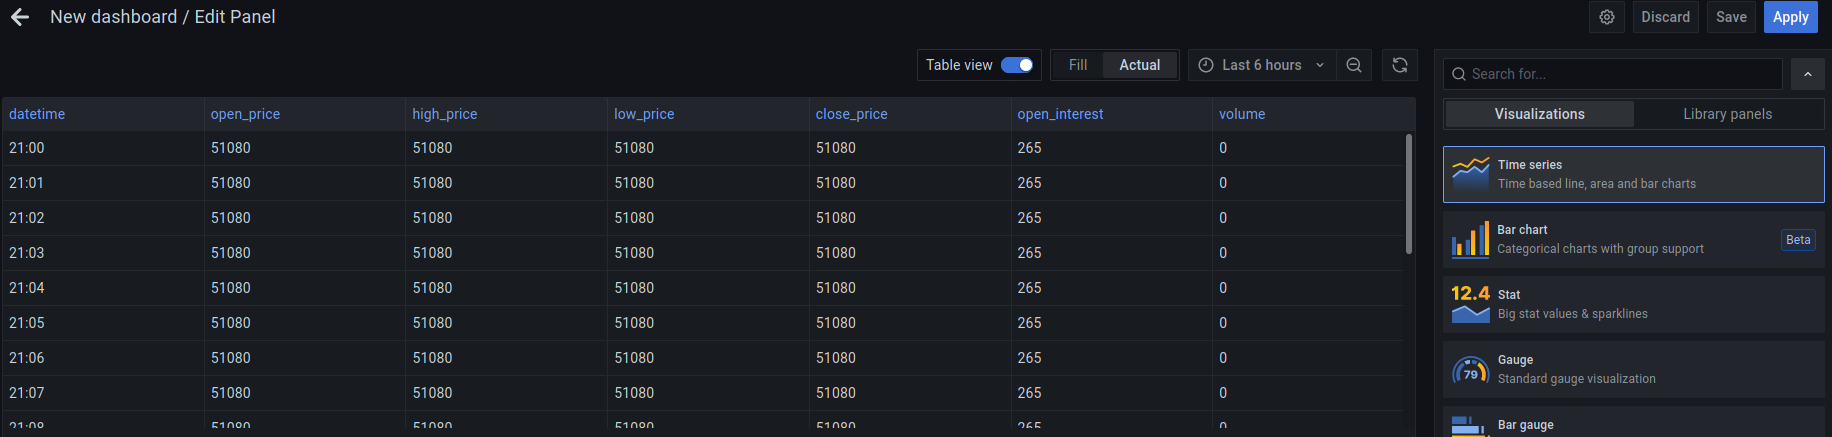
I tried to install csv datasource plugin and successfully to read my data in table view.
But I get trouble in visualizing it with the visulization tools of Grafana. It shows “Data does not have a time field”.
Details are shown in the following pictures.
It confused me and I want to know where can I get help like documentation if I want to successfully use it.
Thanks for your reading and help.
Hi, can you go into your query view and view the underlying SQL for your table? I see you have a column called “datetime”. You may have to alias this in your SQL to “time”. If your query was something like:
SELECT datetime FROM mytable;
Change it to:
SELECT datetime as "time" FROM mytable;
Also check whether your panel is formatted as a “Time series” or a “Table”. I think that “Table” is the option that you want. I hope this helps?
Thanks! Your answer helps a lot!