I have installed Grafana 4.3.2 on windows x64 machine. I successfully connected to localhost:8080 via browser.
I have connected to DB. Now i’m trying to start my first dashboard with just simple query:
SELECT COUNT(OrdNumb) FROM order_status;
I just want to try the simplest example, and see number of orders visually.
If “Format as” is selected as “Time series” i’m getting error: “Found row with no time value”.
If “Format as” is selected as “Table” I’m getting error: “No field name specified to use for x-axis, check your axes settings.
If i go to Axis -> X-Axis and specify “Mode”,” Name" or “Value” whatever i enter here it is deleted as I click mouse anywhere else.
And result is “No data points”.
EDIT: I noticed that X-Axis (mode, name and value) are dropdown, so maybe they should be populated automatically somehow?
Ok this X-Axis error disappears after I press eye symbol. But then no matter which I select on X-Axis (Time, Series or Histogram) I see “no data points” in dashboard.
How can it be if I’m just counting number of rows and table is not empty?
If you use format as table, use the table panel.
The Graph panel requires time series. If you click on show help in the MySQL query editor you have some example for how to format time series queries
Are you using the MySQL data source or InfluxDB? I’m guessing MySQL.
MySQL is not a time series database so you have to model the query to return data in a time series form. A time series should have a timestamp, a metric name and a value per row. This is the most common way to use Grafana. (Usually this is easy as time series databases like Graphite and Influxdb return data in this format but it requires a bit more work to get it right for MySQL).
Can you explain what you are trying to show? SELECT COUNT(OrdNumb) FROM order_status; will only return one data point, why would you want to graph one data point?
There is a Show Help button that explains the format for MySql queries:
You cannot use Table Data for a Graph, it expects time series data.
Ok, thanks.
I’m using MySQL, but still I cannot understand how to construct query as in Show help. It expects to return 3 columns? Thanks
The simple definition is that time series is data observed over time (a sequence of data in chronological order).
Weather measurements are a simple example of time series data - the temperature per day during the last 7 days is a time series or the amount of rainfall per day during the last 7 days is also a time series.
Some Google results (there are lots more):
Thanks, but still I’m getting “No data points” . Here is my query
SELECT
UNIX_TIMESTAMP(StatDate) as time_sec,
Count2 as value,
ModelID as metric
FROM production_device
WHERE $__timeFilter(StatDate)
StatDate is type date, Count2 is type int, ModelID is type char.
If you execute the generated SQL outside of Grafana does it return a result?
You can also check the raw data that Grafana returns from MySQL using the network tab in the Chrome Developer Tools:
https://community.grafana.com/t/how-to-troubleshoot-metric-query-issues/50/2
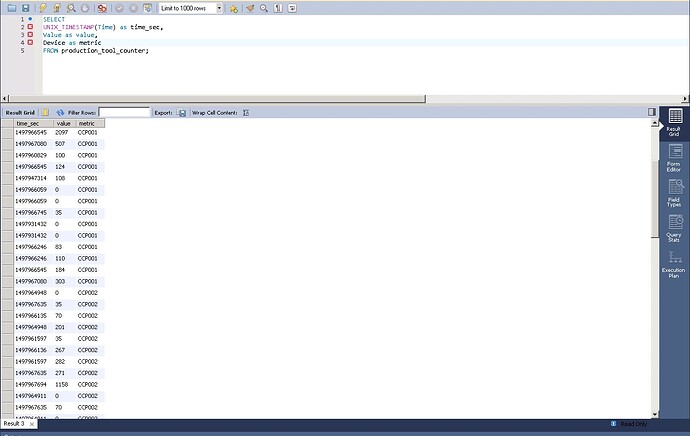
Yes it returns 3 columns but only when last line is not in place. If it is, then you can see error in red as in picture.
BTW, how do you see Generates SQL after Show Help?
The query you tried to run is has a Grafana macro in it which is translated into sql syntax before being sent to the mysql server. From the help:
Macros:
- $__time(column) → UNIX_TIMESTAMP(column) as time_sec
- $__timeFilter(column) → UNIX_TIMESTAMP(time_date_time) ≥ from AND UNIX_TIMESTAMP(time_date_time) ≤ 1492750877
If the query is run it should show the Generated SQL option. Try clicking on the refresh button in the top right corner.
If that does not work, then use the metric troubleshooting guide that I linked to previously to see the raw query and the raw data response.
Hmm,
maybe my UNIXTIMESTAMP is > 1492750877. It is actually date 2017-03-31.
Is it a requirement to be < 1492750877?
That part is dynamic. It depends on what you have chosen in the time picker. Try making the time range larger -> Last 2 days or Last 90 days.
Thanks for help,
I actually added 200d (which should cover 2017-03-31), but still no data point
Have you tried the guide? That should exactly what response you are getting back. And does the generated sql with 200d work outside of Grafana?
Ok I added my production DB (because earlier it was copy DB) and selected data from todays date
But then in Grafana I’m getting error:
How to ignore time values that are 2 years old for example and take only todays
Why do you have a semicolon after the table name? You control the time range through the time picker in Grafana.


