Hi There,
I am a new user to Grafana and have signed up for Grafana Cloud to learn more. I have instrumented a React App using Grafana Faro and set this up in Grafana Cloud.
I have been exploring the built-in “Front-end” dashboard (under the Observability > Front-end tab) to explore various metrics, and logs that have been captured. I decided that I wanted to explore capturing custom events, logs and user tracking, which I found a little difficult to explore using the in-built dashboard. It doesn’t seem that there is a way to edit and modify the built-in front-end dashboard.
So I looked at setting up a custom dashboard. Rather than starting from scratch, I found an existing dashboard (Grafana Faro - Frontend Monitoring | Grafana Labs) that I wanted to expand upon. This dashboard includes most of the panels that the in-built dashboard was showing.
However I quickly noticed that some of the data wasn’t lining up, specifically those relating to web-metrics. I took a look at the documentation (Application performance overview | Grafana Cloud documentation) and can see the following:
The first row shows the average web vitals. To learn more, watch this video walkthrough.
and
Frontend Observability retrieves the web vitals from Loki with the following query:
avg_over_time(
  {kind=\"measurement\", app_id=\"APP_ID"} |= \"WEB_VITAL_NAME" |
  logfmt \$\{FILTERS\} |
  unwrap ${WEB_VITAL_NAME} [$__range]
) by (app)
When I compare this query to those within the dashboard I have imported, the query is almost the same. However the data being shown is completely different. I can confirm that I am using the exact same time frame filters, and made sure to refresh to make sure it is showing the most recent data available.
I looked at the raw Loki log data to compare, and can see that my manual calculations line up with the imported dashboard, and are completely different to what is being reported via the inbuilt dashboard. Please see below:
In-built dashboard:

Imported/custom dashboard:

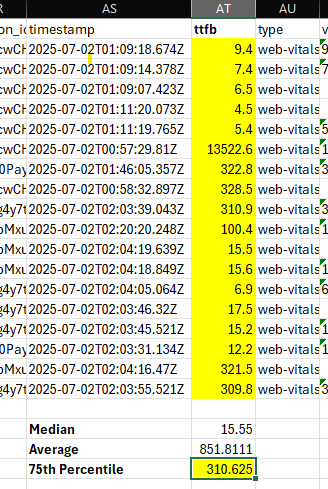
Focusing on the TTFB, you can see the reported numbers vary significantly. As mentioned, when exporting the data and calculating manually, my results match up with the custom dashboard:

Can anyone else explain what’s going on here? I don’t see any filters or anything applied in the inbuilt dashboard. I’m not sure if there is anything extra happening under the hood, but this is not explained in the referenced documentation.
Appreciate any help!