Hello,
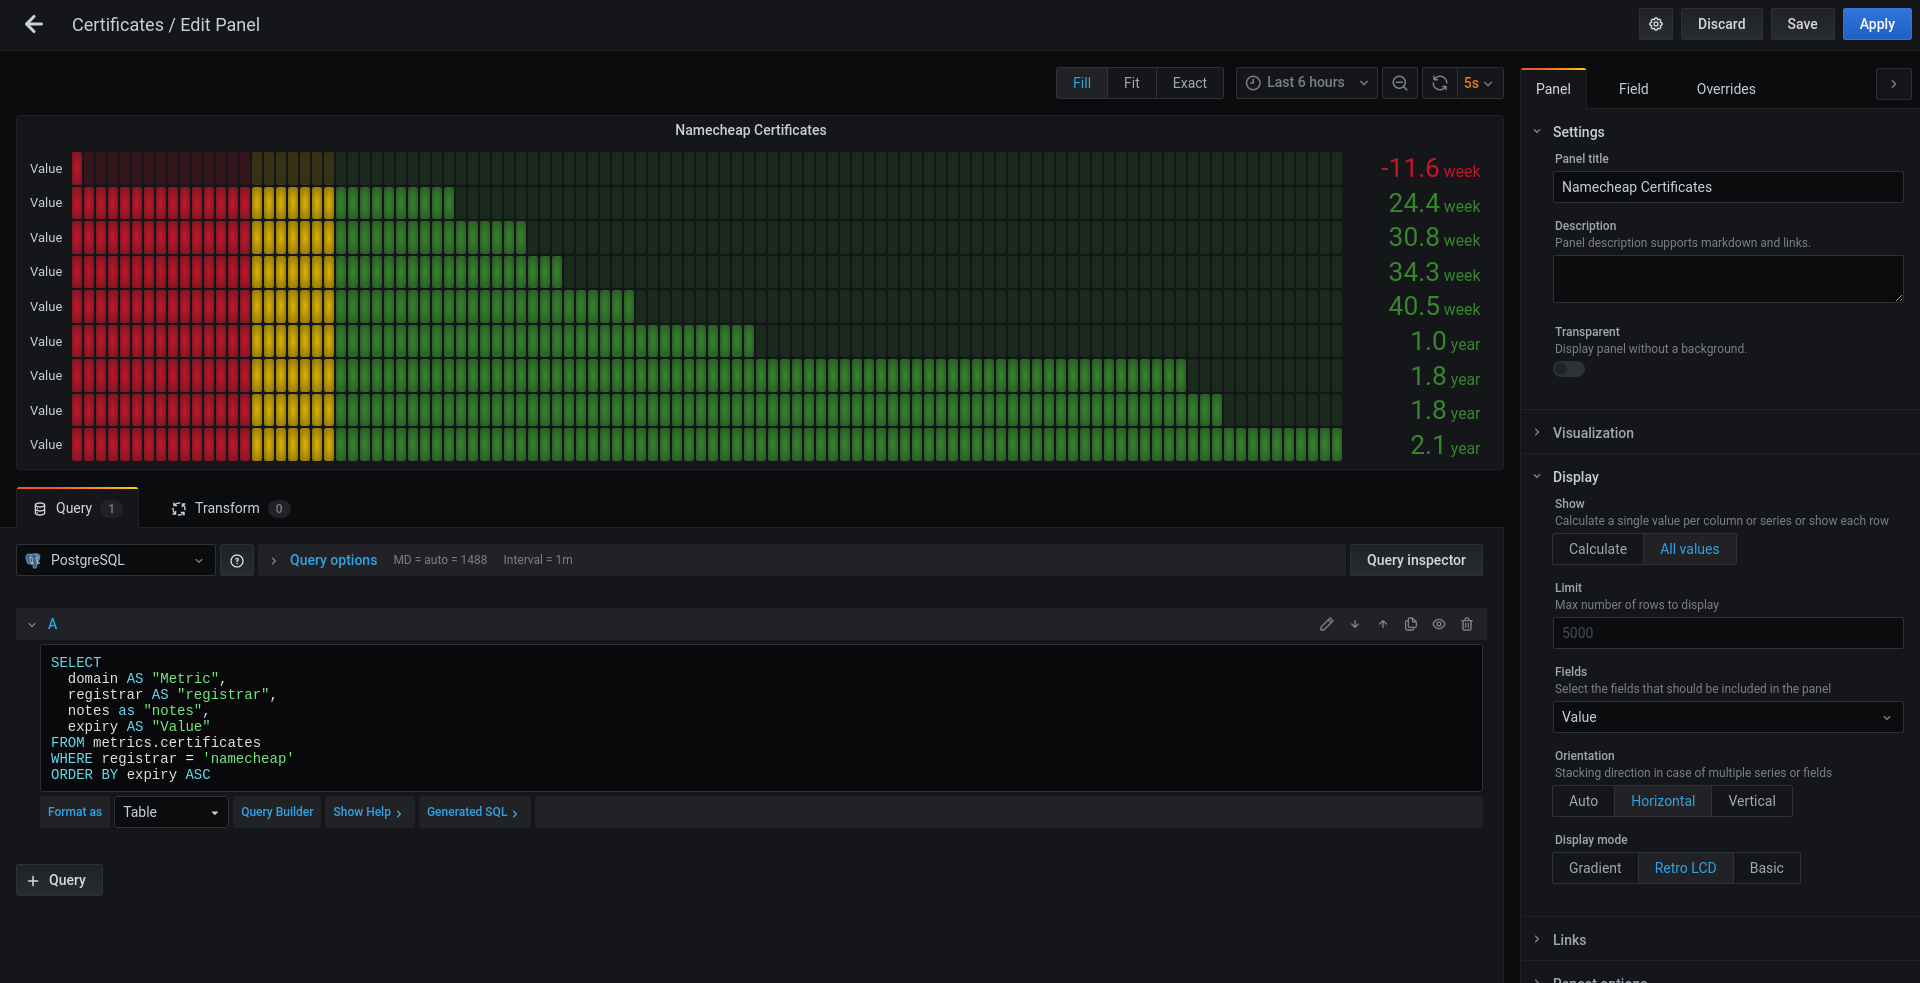
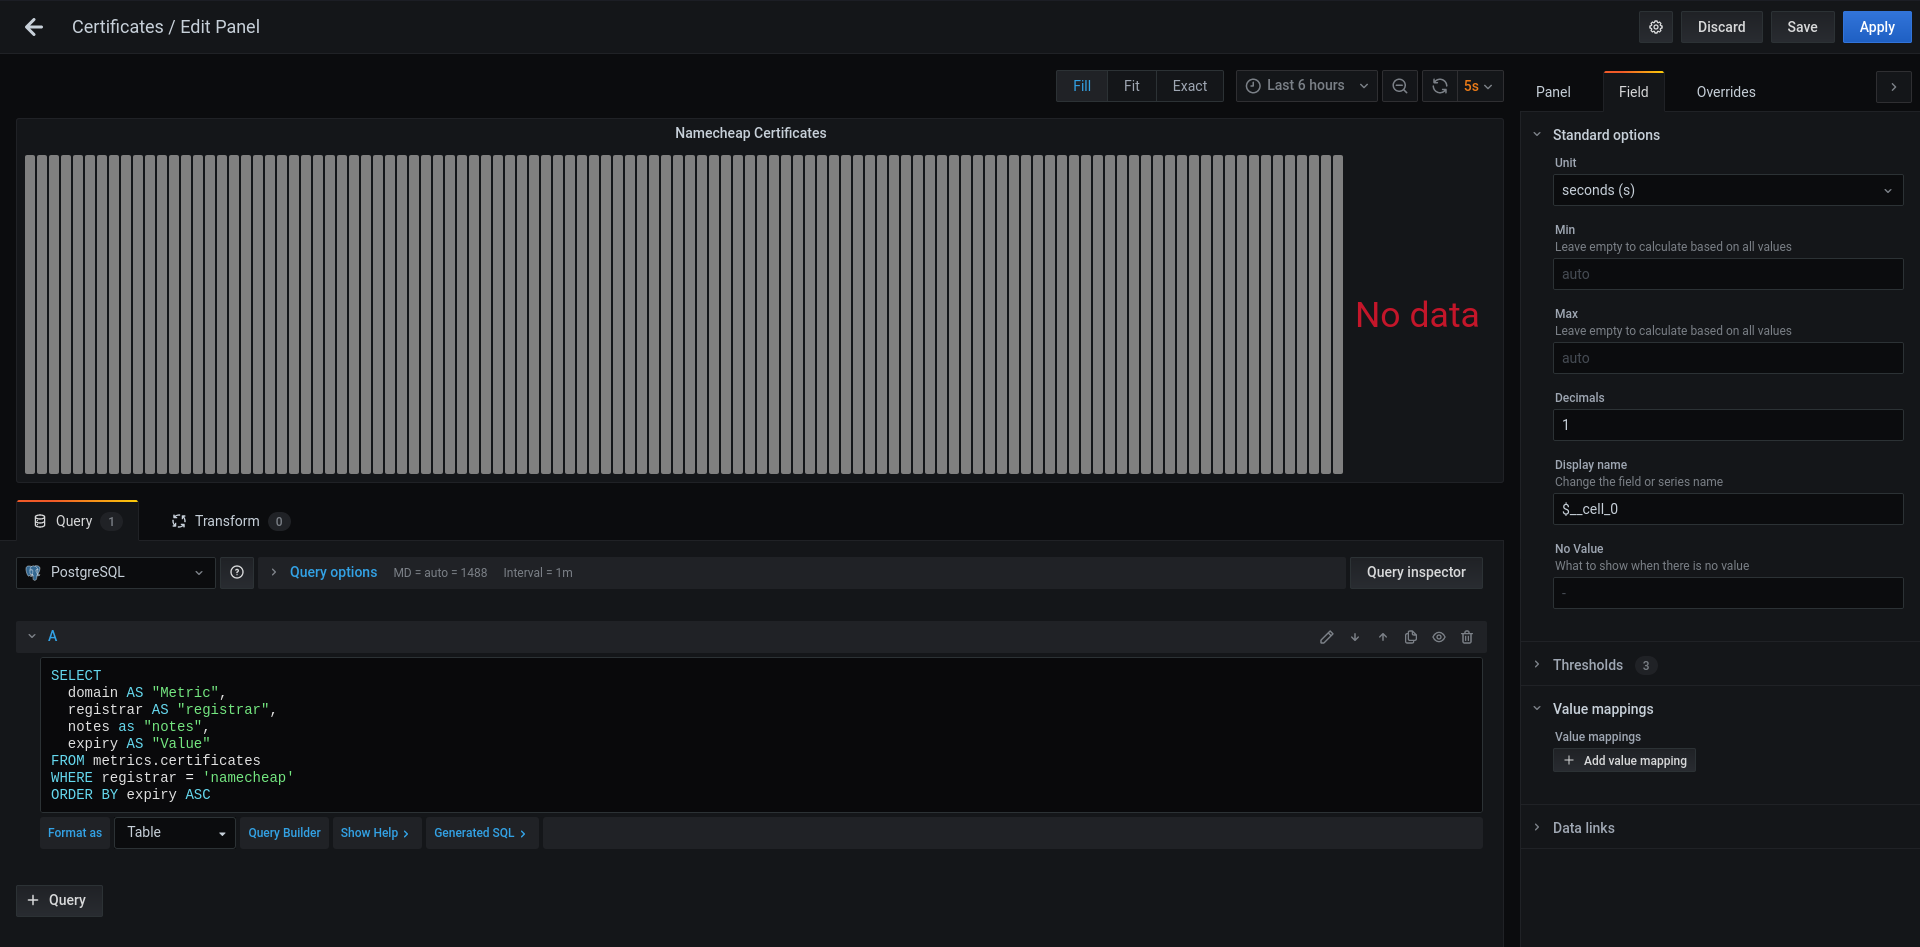
I have upgraded our Grafana from 6.x to 7.0.3 (docker sha256:d72946c8e5d57a9a121bcc3ae8e4a8ccab96960d81031d18a4c31ad1f7aea03e). Everything works except my bar chart. I have a dashboard with SSL certificate expiry times that we have on the monitoring TV near our desks. It is a table (not timeseries) that has the domain name and the expiry time in seconds. I have tried setting the “Display name” field on the “Field” tab to $__cell_0, ${**cell_0}, ${__series.name} and ${**field.name} to absolutely no result. If I put any of those values to the Display name field, it says “No data” in the bar chart. Is this a bug? Am I doing something wrong? Are my settings wrong? It did work on the previous 6.x release. Thanks for your help guys.