Grafana version and what operating system are you using?
Ubuntu 22.04, Linux container, 4 cpu’s, 4GB of RAM
Grafana: v10.2.3
InfluxDB: v2.7.4
What are you trying to achieve?
I use the “Proxmox VE Cluster [Flux]” dashboard to analyse metrics for a Proxmox Cluster and want to view the metrics for the last 30 days.
What happened?
The dashbard works fine for 24 hours selection, even 2 days, but for more than that period it either only returns partial data or nothing.
What did you expect to happen?
I expect it to return all the data and display it in the graphs.
Can you copy/paste the configuration(s) that you are having problems with?
No
I’ve searched without success to find where this query is that the dashboard uses. If someone can point me to the location or send a screenshot of where to find it, it would be great. I’m not unfamiliar with querying databases, but the dashboard doesn’t reveal it secrets easily it seems!
When you set up influx DP as a data source, it would have asked you for the URL. That URL is where you can find influx data explorer. It’s a separate program and has a separate login… usually it’s https://your-ip-address;8086
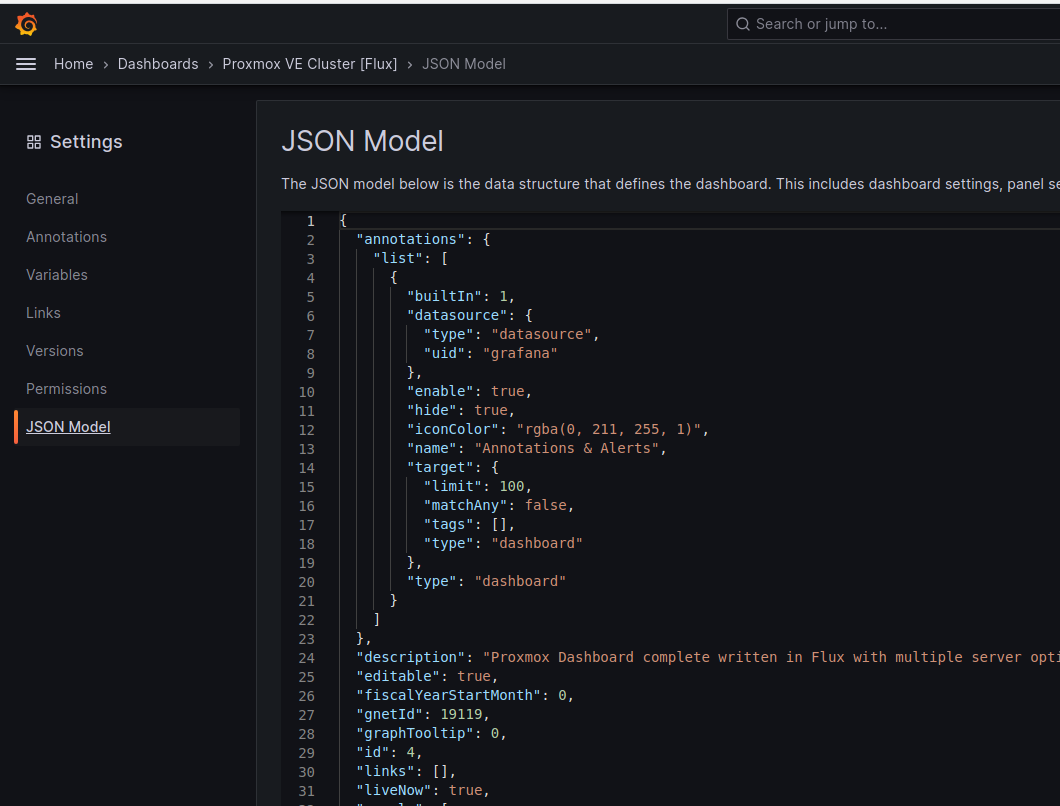
However, the query that populates the dashboard is not in there. Under the dashboard setting (select the “gear” icon top right) has this screen, which is the json for the dashboard I presume.
Aha! When I go to a particular graphs in the dashboard and opt to edit that, I see the queries for that graph. So the dashboard actually contains many queries (which I assumed must be the case anyway). Here is one that times out when I select “30 days” for example:
Having discovered this in the dashboard, I see there is a “query options” button with a “query inspector” feature. I’m using that now to see what I can learn about the problem.
A

Status: 500. Message: context deadline exceeded (Client.Timeout or context cancellation while reading body),context deadline exceeded (Client.Timeout or context cancellation while reading body)
I really don’t need to understand the full dashboard if I’m just a user of it, do I? I’m not able to use the product within the parameters that it provides. Unfortunately there seems no way to contact the creator of the dashboard, @mephisto, in the environment where the dashboards are posted. That is unfortunate, since it’s really a great way to view the statistics of a proxmox cluster.
The bottom line is (I think) that the rows returned are likely too many when I select a period of 30 days, since it works for 2 days and mostly for 7 days too. The error message “Client.Timeout or context cancellation while reading body” makes it clear that the query takes too long. So in my mind the solution is simple: Increase the default timeout. How that can be done is not clear however.
Correct: The $ is doesn’t like is this one: filter(fn: (r) => contains(value: r["nodename"], set: ${server:json}))
But ${server:json} is an array it seems, so I can’t simply replace that with a server name?