Hello to all,
i got a strange Problem. I am trying to move away from FHEM SVG Plots to FHEM with Grafana. The DB Queries are easy to setup but i am struggeling with a constant 2h offset Grafana is displaying …
I checked on the TZ Config on all 3 Machines involved (moved between three windows and typed date):
Fhem Server:
pi@fhempi:~ $ date
Mon 1 Oct 14:54:14 CEST 2018
mysqlServer:
root@xxxx:~# date
Mon Oct 1 14:54:18 CEST 2018
Grafana Server:
pi@PiHole:~ $ date
Mon 1 Oct 14:54:22 CEST 2018
They use same Timeserver.
Just comparing the old SVG plot and the Grafana plot i do see:
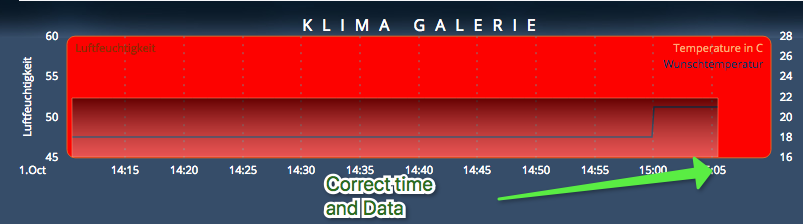
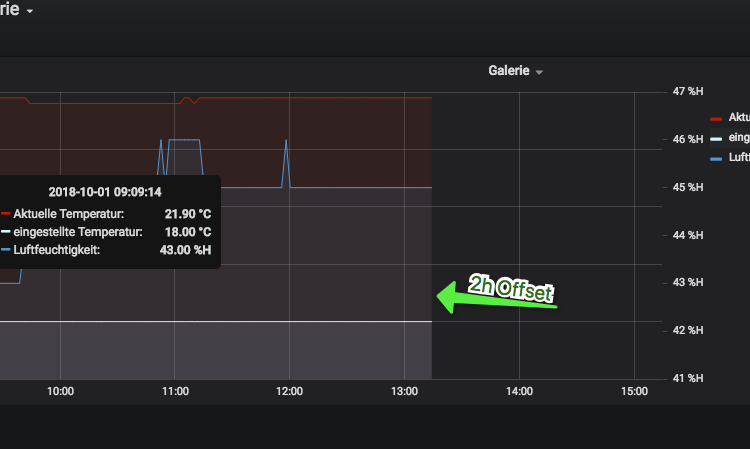
in comparison Grafana is 2h late:
Looking at the raw data in the mysql DB i do see that the data is correct (NB - i did look into this DB a couple of minutes later but it’s showing the correct time)
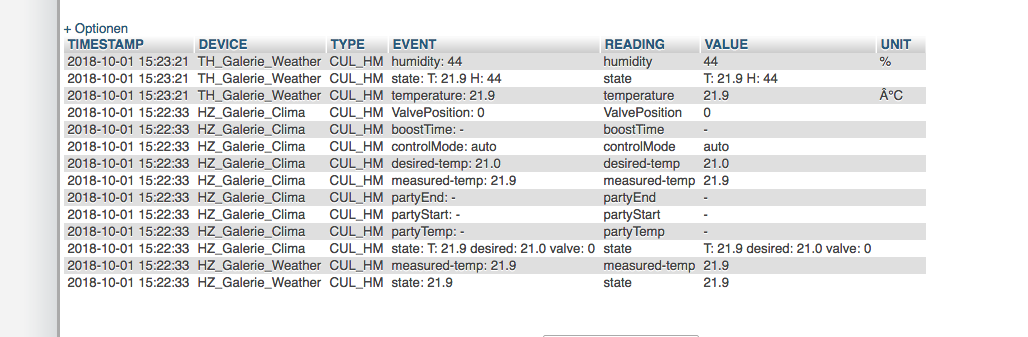
So FHEM is logging it to Mysql correctly, SVG is plotting it correctly - why does Grafana has the 2h offset?
TIA
Christian