Hello
I have a problem with Config query from results and thresholds.
First of all I need to configure more than one dynamic threshold green/yellow/red. All I achieved was single threshold so when value excessed last generated threshold value in config querry it becomes red. Can we have threshold2 set up?
Second problem is that my colors are ignored and defaults are used. Documentation is not enough and example on play.grafana.com also is using only one threshold and do not overwrittes colors.
Grafana
Played a bit with above dashboard and did not find a way to define colors by myself and even that we have two values in csv dataset only one threshold is applied.
Is it a limitation? Idea with using variables in thresholds was much simplier to use.
Hi
Maybe someone has solution for that?
I tried with Grafana 12.1.0 and still I can set up only one threshold as on screenshot:
It can be done. Query should return a few fields and then it is possible to setup multiple thresholds from multiple dynamic values.
Hello @szymonzy1 ,
i have implement this problem using postgresql data souce
Step: 1 Create the Table and Insert Data at 5-Second Intervals
CREATE TABLE sensors_data (
    id SERIAL PRIMARY KEY,
    field1 INTEGER CHECK (field1 BETWEEN 10 AND 100),
    field2 INTEGER CHECK (field2 BETWEEN 10 AND 100),
    field3 INTEGER CHECK (field3 BETWEEN 10 AND 100),
    field4 INTEGER CHECK (field4 BETWEEN 10 AND 100),
    updated_at TIMESTAMP DEFAULT CURRENT_TIMESTAMP
);
DO
$$
DECLARE
     i INTEGER := 0;
    field1 INT;
    field2 INT;
    field3 INT;
    field4 INT;
BEGIN
    WHILE i < 10 LOOP  -- run 10 times
        PERFORM pg_sleep(5);

        -- generate random values
field1 := 10 + TRUNC(RANDOM() * 91)::INT;
        field2 := 10 + TRUNC(RANDOM() * 91)::INT;
        field3 := 10 + TRUNC(RANDOM() * 91)::INT;
        field4 := 10 + TRUNC(RANDOM() * 91)::INT;


             INSERT INTO sensors_data (field1, field2, field3, field4, updated_at)
            VALUES (
			field1,
			field2,
			field3,
			field4,
			NOW());


        COMMIT;
         RAISE NOTICE ' Inserted: f1=% f2=% f3=% f4=%', field1, field2, field3, field4;

        i := i + 1;
    END LOOP;
END;
$$;
Step: 2 Add canvas visualization
Step: 3 Set up the layer as multi-value
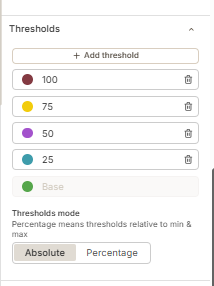
Step:4 Setup the Thresholds
Step: 5 Panel query to fetch the data
SELECT * FROM sensors_data
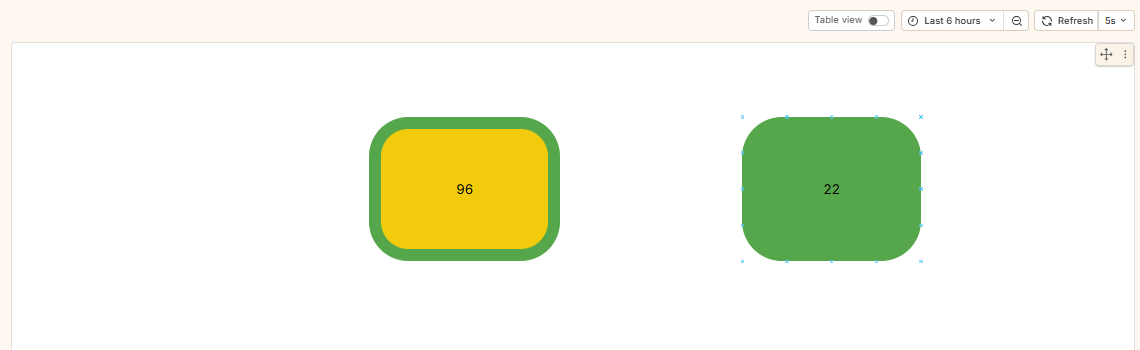
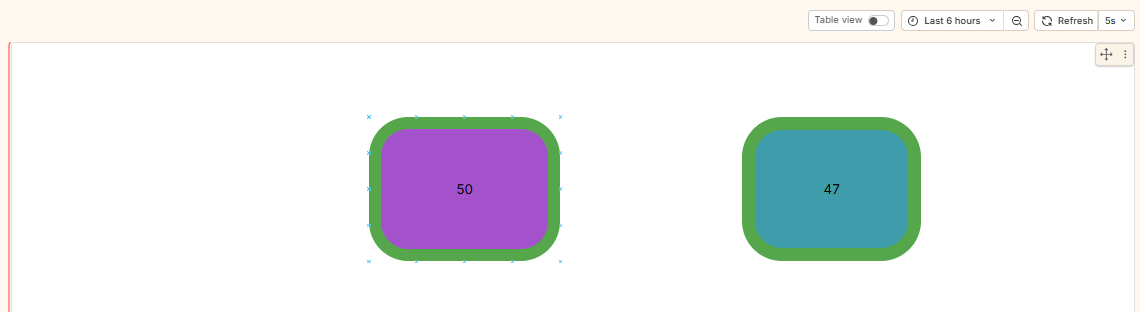
Final output : value will be change and out thresold color will be change according to