Can we change the color of a cell based on an other cell?
performance_threshold value can be 0/1
OR
4 Likes
+1
Color row used to be an option, but I do not believe it still is.
Use Overrides to select a column you like to add effects to.
4 Likes
@gurpartapsbhatti , I wanted something which can apply threshold row wise. Or where one column’s threshold depend on an other column
I’m not sure if I understand what you mean. The way I understood is that since ‘value’ of Total column depends on metric1 and metric2, therefore the threshold for Total depends on the ‘value’ of metric1 and metric2.
Is this possible where the value is textual? eg: elasticsearch status colours? (green, red, yellow)
1 Like
Its possible to color cells with Textual values
1 Like
I don’t understand how to choose the colour in the value mapping editor?
Good question!
3 Likes
Example I gave you was from Grafana 8.0 beta, I don’t think its available in the older versions.https://play.grafana.org/d/U_bZIMRMk/table-panel-showcase?orgId=1
1 Like
I’ve found a feature request on this
opened 01:29PM - 28 Mar 18 UTC
area/panel/singlestat
area/panel/table
type/feature-request
type/ux
## Introduction
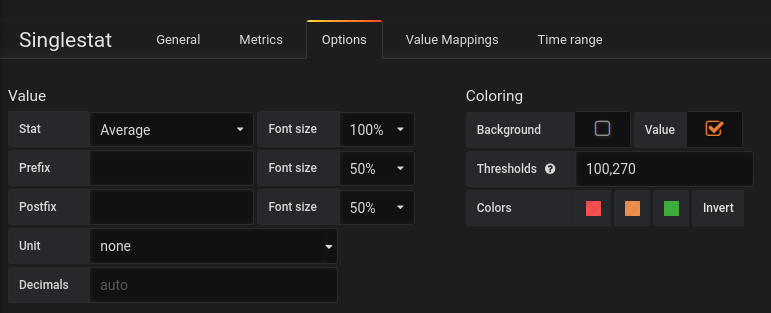
As of writing (Grafana v5.1-pre) we have support for
* colo… ring background/value in the Singlestat panel based on a numeric range and 3 colors
* coloring cell/value/row in the Table panel based on a numeric range and 3 colors


There are a lot of feature requests/issues requesting greater support of coloring in table panel and the singlestat panel:
* #7631 [Feature request] Allow Text to Value mappings in Singlestat panel
* #3601 table panel: colorize cell value based on regex pattern match
* #9500 Feature request: Allow thresholds for Time column in tables
* #3608 Thresholds with more than 3 comma-separated values
* #8404 [Feature request] Singlestat null value color
* #4821 Table Panel coloring shouldn't require display of referenced column
* #9709 Single stat panel with gradient color
* #7411 [Feature request] Variable threshold values in Singlestats panel
* #7286 [Feature request] Row and/or Column styles in Table
Historically we've received a few PR's that tried to solve some of the issues above, but we haven't been able to merge them because we feel the solutions are either hard to understand from a user perspective or either it makes the Grafana code base/features more and more shattered.
## Proposal
This issue aims to find one solution for solving all (or most) of the issues above and by that delivering a good and consistent user experience. By that said, we probably want to split this up in smaller issues if we decide that this is a good way forward.
In general the *Conditions editor* for alerts are very similar to a rule/conditional formatting editor functionality and would probably fit quite nice with a few modifications. This is something to take into considerations when implementing this.

### Conditional rules evaluator
A panel needing conditional formatting shouldn't need to implement their own solution for evaluating conditional rules thus making this a core component/helper library is a must.
It would be nice if this component also could return a list of rule types that it supports.
Examples of rule types:
* Value is empty
* Value is not empty
* Text contains
* Text does not contain
* Text starts with
* Text ends with
* Text is exactly
* Date is
* Date is before
* Date is after
* Greater than
* Greater than or equal to
* Less than
* Less than or equal to
* Is equal to
* Is not equal to
* Is between
* Is not between
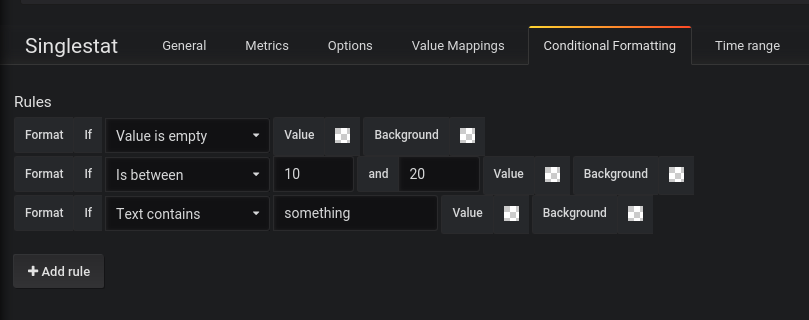
### Singlestat panel - colorize background/value
Changes here compared to current functionality is that
* it allow you to define unlimited amount of color formatting's compared to today's maximum of three.
* it allow support for coloring based on empty/non-empty values
* it allow support for coloring based on string/text values
* it allow support for coloring based on date/duration values
#### UX mockup/example to underline functionality needed/wanted

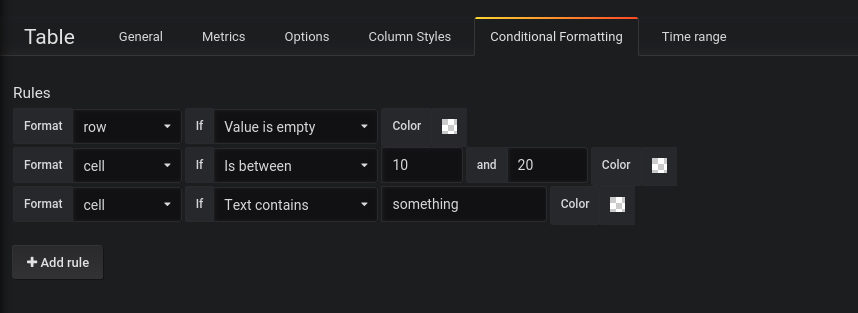
### Table panel - colorize cells/values/rows
Changes here compared to current functionality is that
* it allow you to define unlimited amount of color formatting's compared to today's maximum of three.
* it allow support for coloring based on empty/non-empty values
* it allow support for coloring based on string/text values
* it allow support for coloring based on date/duration values
* it allow support for coloring a row based on a hidden/non-rendered column
Currently you can define thresholds for each defined *Column style*. Maybe we want to continue having this possibility since we can make smart decisions of what columns to apply the conditional formatting rules to.
On the other hand it quite weird to continue using the column styles since they're basically provides options for how to render column cells/convert raw column value using specific data types and options etc. Regarding coloring we currently supports cell/value/row which affects cells or rows and rules are evaluated based on the raw data returned from data source query, that is not after conversion/options. In the mockup below there's a really simple UX which basically would scan all rows and columns returned from data source query to apply conditional formatting.
One option to having conditional formatting inside the *Column style* tab would be to allow conditional formatting rules to be applied per columns basis under a specific tab. Basically like the mockup below but with additional logic to decide which columns the rules should be applied to. This solution have an advantage because it can support conditional formatting of rows based on a hidden/non-rendered column.
#### UX mockup/example to underline functionality needed/wanted

### Forward compatibility
Any changes needed to existing Singlestat and Table panel JSON models should be forward compatible, meaning that existing saved dashboards with Singlestat/Table panel having coloring/threshold enabled should be migrated/converted to the new solution when such a dashboard is rendered.
Useful discussion, thanks, to all!
livepo
May 27, 2021, 7:49am
13
you can use emoji to replace text value.
boazr
June 28, 2021, 9:52am
14
I found the following way to color table cells based on text value, by taking advantage of the fact that threshold colors get evaluated before value mappings are performed.
So, say you have some query that returns label values A , B and C , and you want to color them in a table with red , green , blue respectively, here’s what you do:
1. Modify your query to map the label values into numbers.namespace are A , B and C ):
sum(cpu_usage{cluster="my_cluster"}) by (namespace)
to:
sum(
 label_replace(
 	label_replace(
 		label_replace(
 			cpu_usage{cluster="my_cluster"},
 			"namespace", "1", "namespace", "A"
 		),
 		"namespace", "2", "namespace", "B"
 	),
 	"namespace", "3", "namespace", "C"
 )
) by (namespace)
2. Define threshold colors so that:1 => red 2 => green 3 => blue
3. Define value mappings so that:1 => A 2 => B 3 => C
Hey guys, i have been checking version 7 and 8 and still dont see how to make it work, i have a name of something call it “City” and i want to color it based on the value of temp, and thats it, i dont want to show the temp, i just want to show the city name colored by something else.
before i did it whit the row background color, but now is not doable.
can you help me, or do i miss something?
2 Likes
+1
I want to do something very similar like @pakoche1 .
Same, I am also looking for the functionality that @pakoche1 mentioned.
Specifically, I have a field for date and I want to know how overdue that date is. For example, if the date was 7 days ago it’s red, 3 days ago it’s yellow, etc. You can easily format the date to show “7 days ago” versus “2022-02-16”, for example, but there is no way to color that cell based on the duration.
I can partially produce what I want by doing something like UNIX_TIMESTAMP()-UNIX_TIMESTAMP(some_date), then coloring the cell based on how many seconds have passed, but this is ugly and unintuitive for the end user. (How long ago is 599282 seconds?)
1 Like
Is any one has the solution for this?
Can we change the color of a cell based on an other cell
I am using two panel.
1st panel having the column a,b,c
using transform i join both the panel…
I can see the data in table a,b,c,d,e
I want to compare b,d is not equal change the colour of b and d.
is this possible.
1 Like
I am trying to change the color in dashboard Diskspace row should be orange and monitor Down should be red. I am using Grafana v6.0.0. Does anyone know how to do this. Thank you in advance.
Welcome to forum @rkoirala82
1 Like


