-
What Grafana version and what operating system are you using?
my Grafana version : 12.0.2 -
What are you trying to achieve?
I try to show value top of Bar chart in Time series Visualization but is not
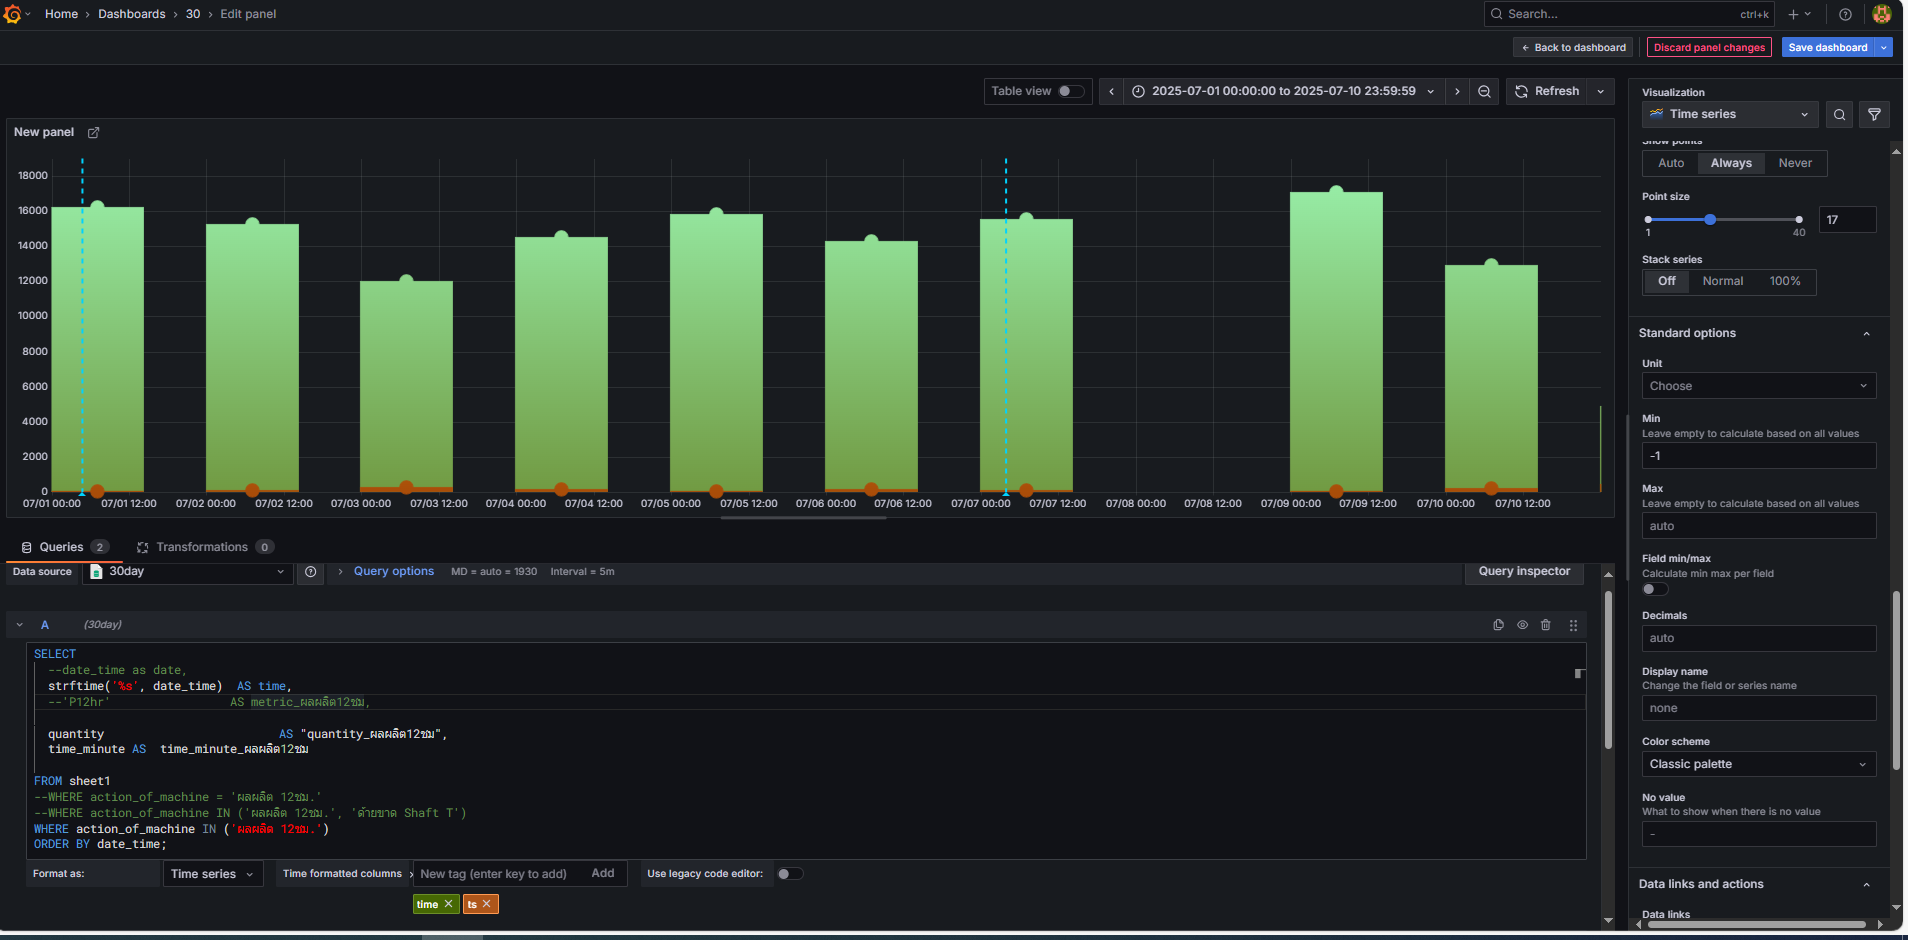
i expect to show value top of
-
How are you trying to achieve it?
select time series and create Bar chart -
What happened?
Bar chart in Time series can’t show value on top -
What did you expect to happen?
i expect to show value top of Bar chart in Time series Visualization
i can show value top of Bar chart in Bar chart Visualization but is not my expected
-
Can you copy/paste the configuration(s) that you are having problems with?
-
Did you receive any errors in the Grafana UI or in related logs? If so, please tell us exactly what they were.
-
Did you follow any online instructions? If so, what is the URL?

