Hi, I am new to Grafana and I have started with AWS Managed Grafana (v8.0). My questions are: Can I manage multiple data sources in different AWS accounts from a single Grafana, or do I need a Grafana for each account? If possible, how do I link the dashboards to each data source to make my alerts independent?
Thank you very much.
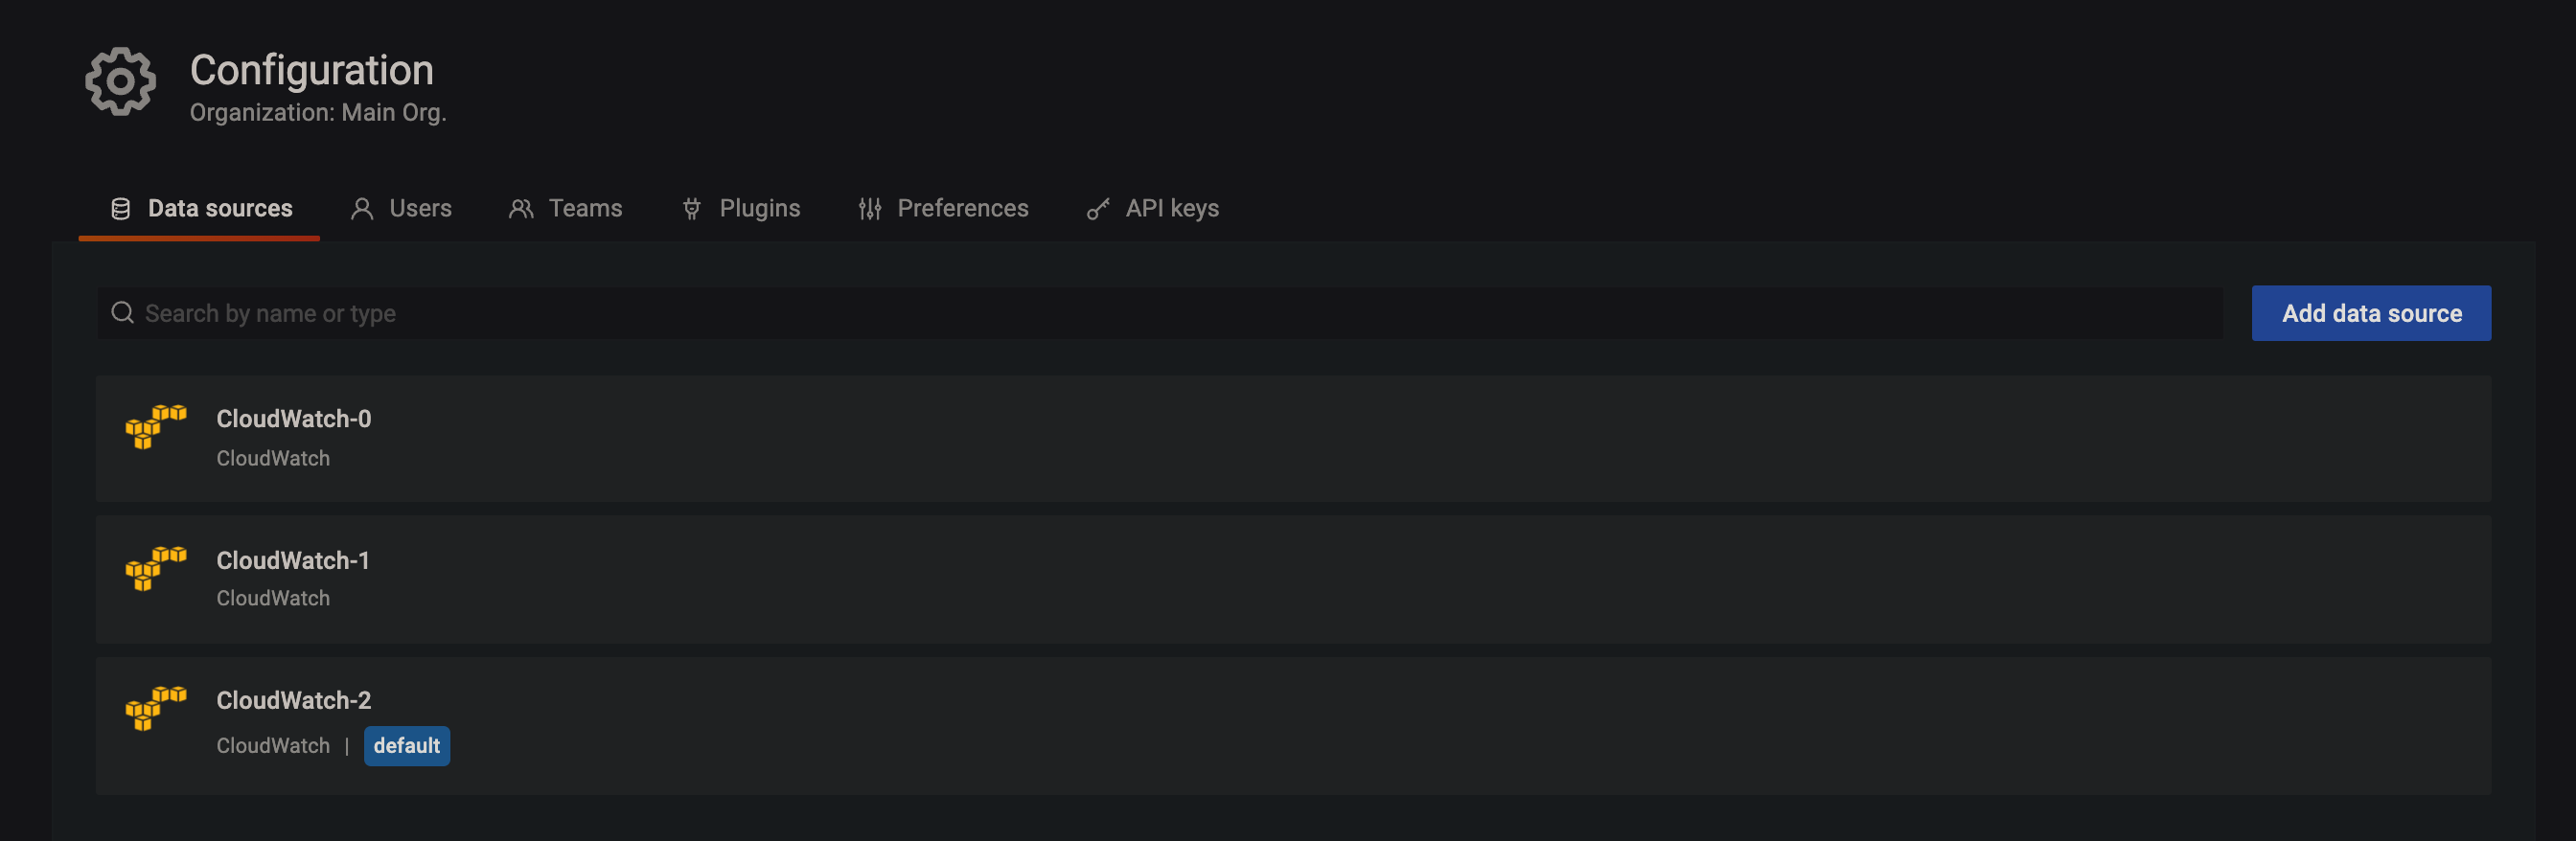
@mdonaire you should be able to add multiple copies of any datasource that is allowed within AMG. So you could create 7 distinct Prometheus datasources, or multiple copies of the AWS Cloudwatch Datasource
I’m assuming you will be able to do this in AMG. If not, report back with details 
1 Like
Thanks for your reply @anon70503803! Then, how can I link my dashboards to each data source? I have to create alerts for each datasource/dashboard and the have to work simultaneously. All the dashboard should be managed from one Grafana…
Yes. I would suggest you explore our sandbox, play.grafana.org, and then view our docs on adding a datasource.
If you are asking how to view multiple datasources dynamically using one dashboard, you can create multiple queries–one for each resource. You can also use template variables like this
https://play.grafana.org/d/000000056/templated-dynamic-dashboard?orgId=1&var-app=country&var-server=All&var-interval=1h