I am trying to plot the one panel in Grafana, which should be fixed.
Like if today’s date is 5 Nov then always Grafana panel time should be from 4 Nov 06:00 to 5 Nov 6:00. I am able to write the flux query for the same but grafana panel duration is keep changing based on the time.
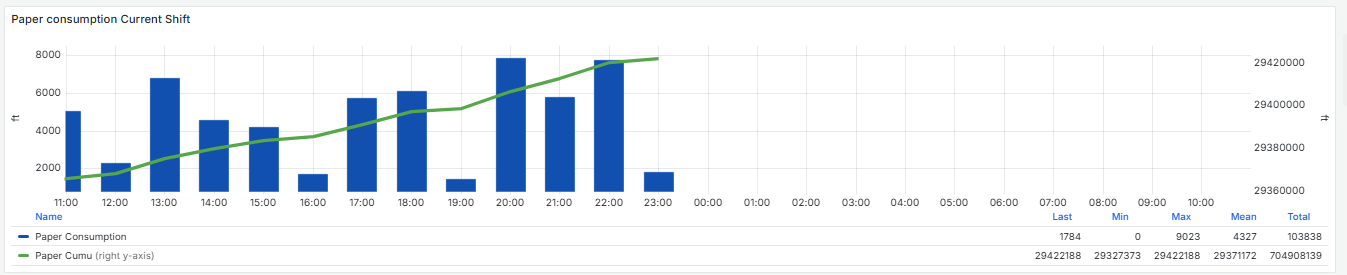
in the below panel data is showing from 11:00 to 10:00 but I want to keep this from 6:00 to 6:00
my query is generating the output from 6:00 to 6:00 but panel duration is keep changing.
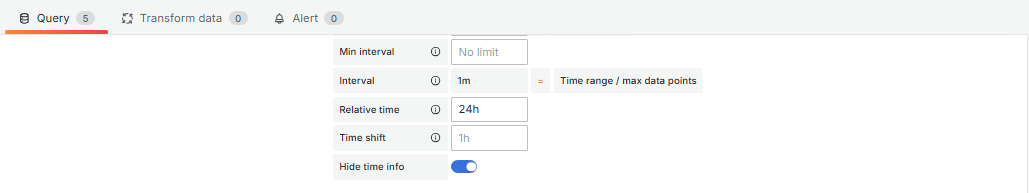
I have tried the query option as well in Grafana panel.
I tried passing this in in relative time From: now/d + 6hTo: now/d + 30h but it’s not working.
Is there any way I can fix the time duration of the panel from 06:00 to 6:00?
Thanks
grant2
November 7, 2025, 12:37am
2
Can you share your Flux query?
import "date"

start_time = date.sub(from: date.truncate(t:now(), unit:1d), d: 1d)
final_start_time = date.sub(from:start_time, d:-4h)
stop_time = date.sub(from: final_start_time, d: -26h)


from(bucket: "bucket")
    |> range(start: final_start_time, stop: stop_time)
    |> filter(fn: (r) => r["_field"] == "field")
    |> aggregateWindow(every: 1h, fn: last, createEmpty: false)
    |> map(fn: (r) => ({
        r with
        _time: r._time,
        _value: r._value,
        "start_time": start_time,
        "stop_time": stop_time,
    }))
    |> difference()
    |> truncateTimeColumn( unit:1h)
    |> group(columns: ["_time"])
    |> cumulativeSum(columns: ["_value"])
    |> last()
    |> filter(fn: (r) => exists r._value)
    |> map(fn: (r) => ({

        time: r._time,
        "Paper Consumption": r._value,
    }))
    |> tail( n:24, offset: 1)
    |> yield(name: "last")
Try setting Relative time to 30h:
Also take a look at this topic - may be some ideas would work for your case