Hey guys,
I am really frustrated because I’ve been fiddling around and really have no clue what the cause of my problem is. I want to do the following:
I have a sensor that counts “produced parts” (with 1/0) and I want two things shown:
In a specific time windows → a) overall parts ; b) parts per hour
In my graph it seems to work but the singlestat is only right for windows of 1 or 2 hrs but becomes wrong for more.
E.g.:
Timespan 15:00 - 16:00
Parts overall: 90
Parts per hour: 90
Timespan 15:00 - 17:00
Parts overall: 90
Parts per hour: 45
Timespan 15:00 - 18:00
Parts overall: 90
Parts per hour: 30
Seems correct in the graph, but in the singlestat I get the following:
Timespan 15:00 - 16:00
Parts overall: 90
Parts per hour: 90
Timespan 15:00 - 17:00
Parts overall: 90
Parts per hour: 45
Timespan 15:00 - 18:00
Parts overall: 90
Parts per hour: 45
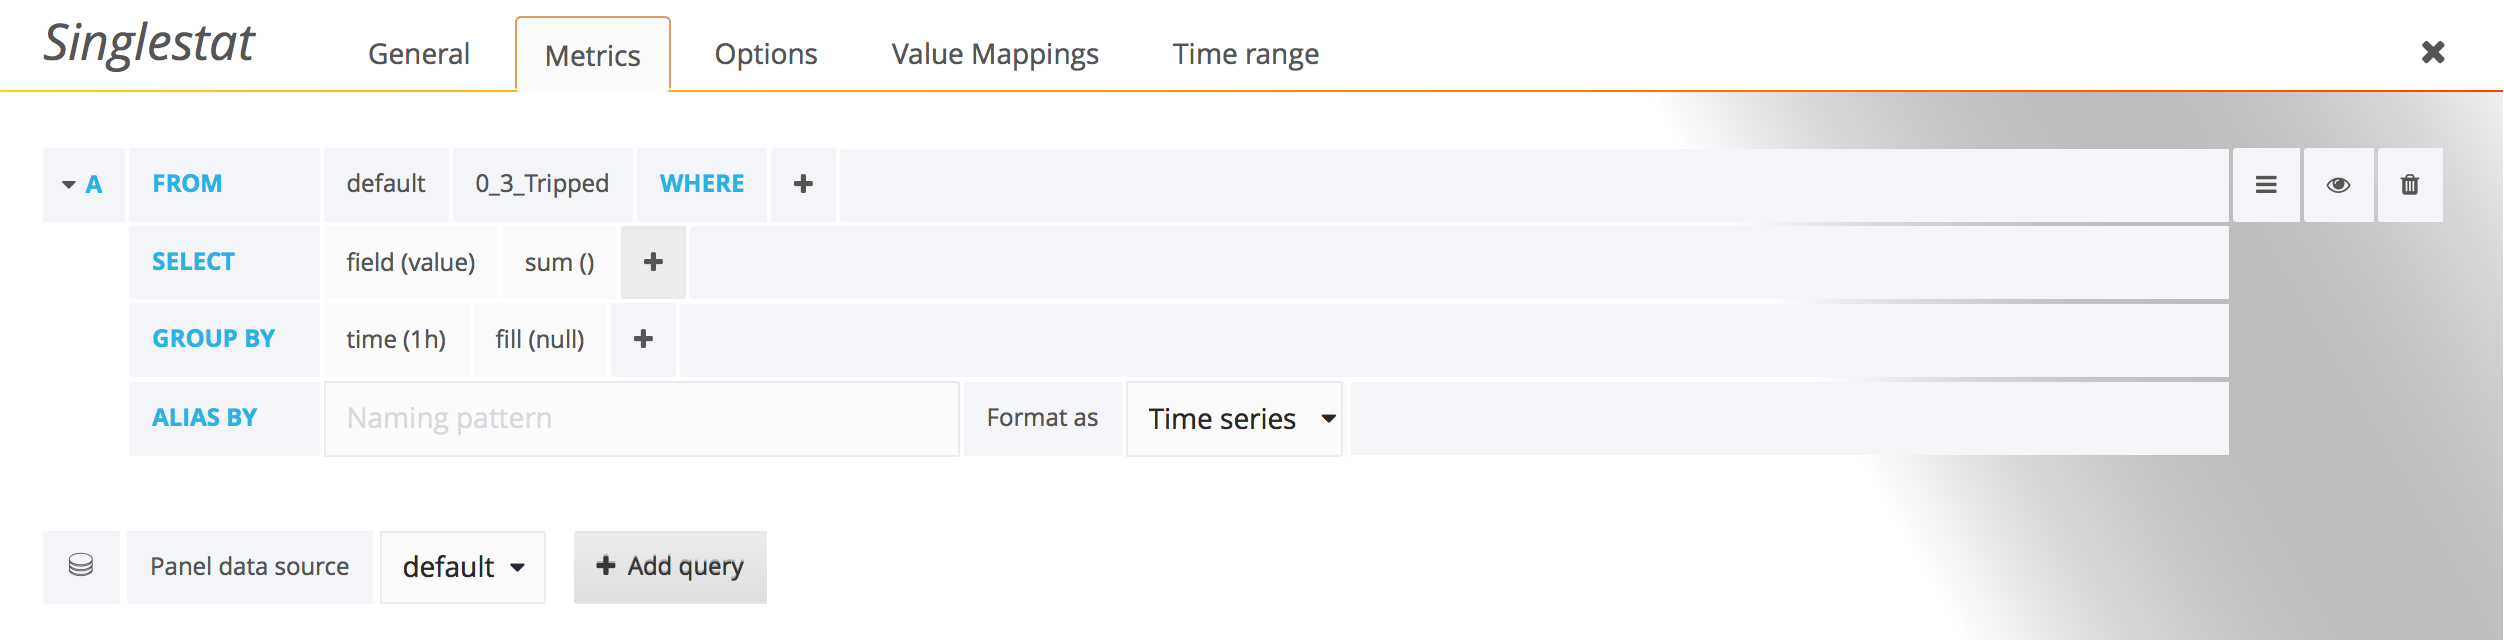
I have no clue what is wrong. I use exactly the same query and have chosen AVG for the singlestat value.
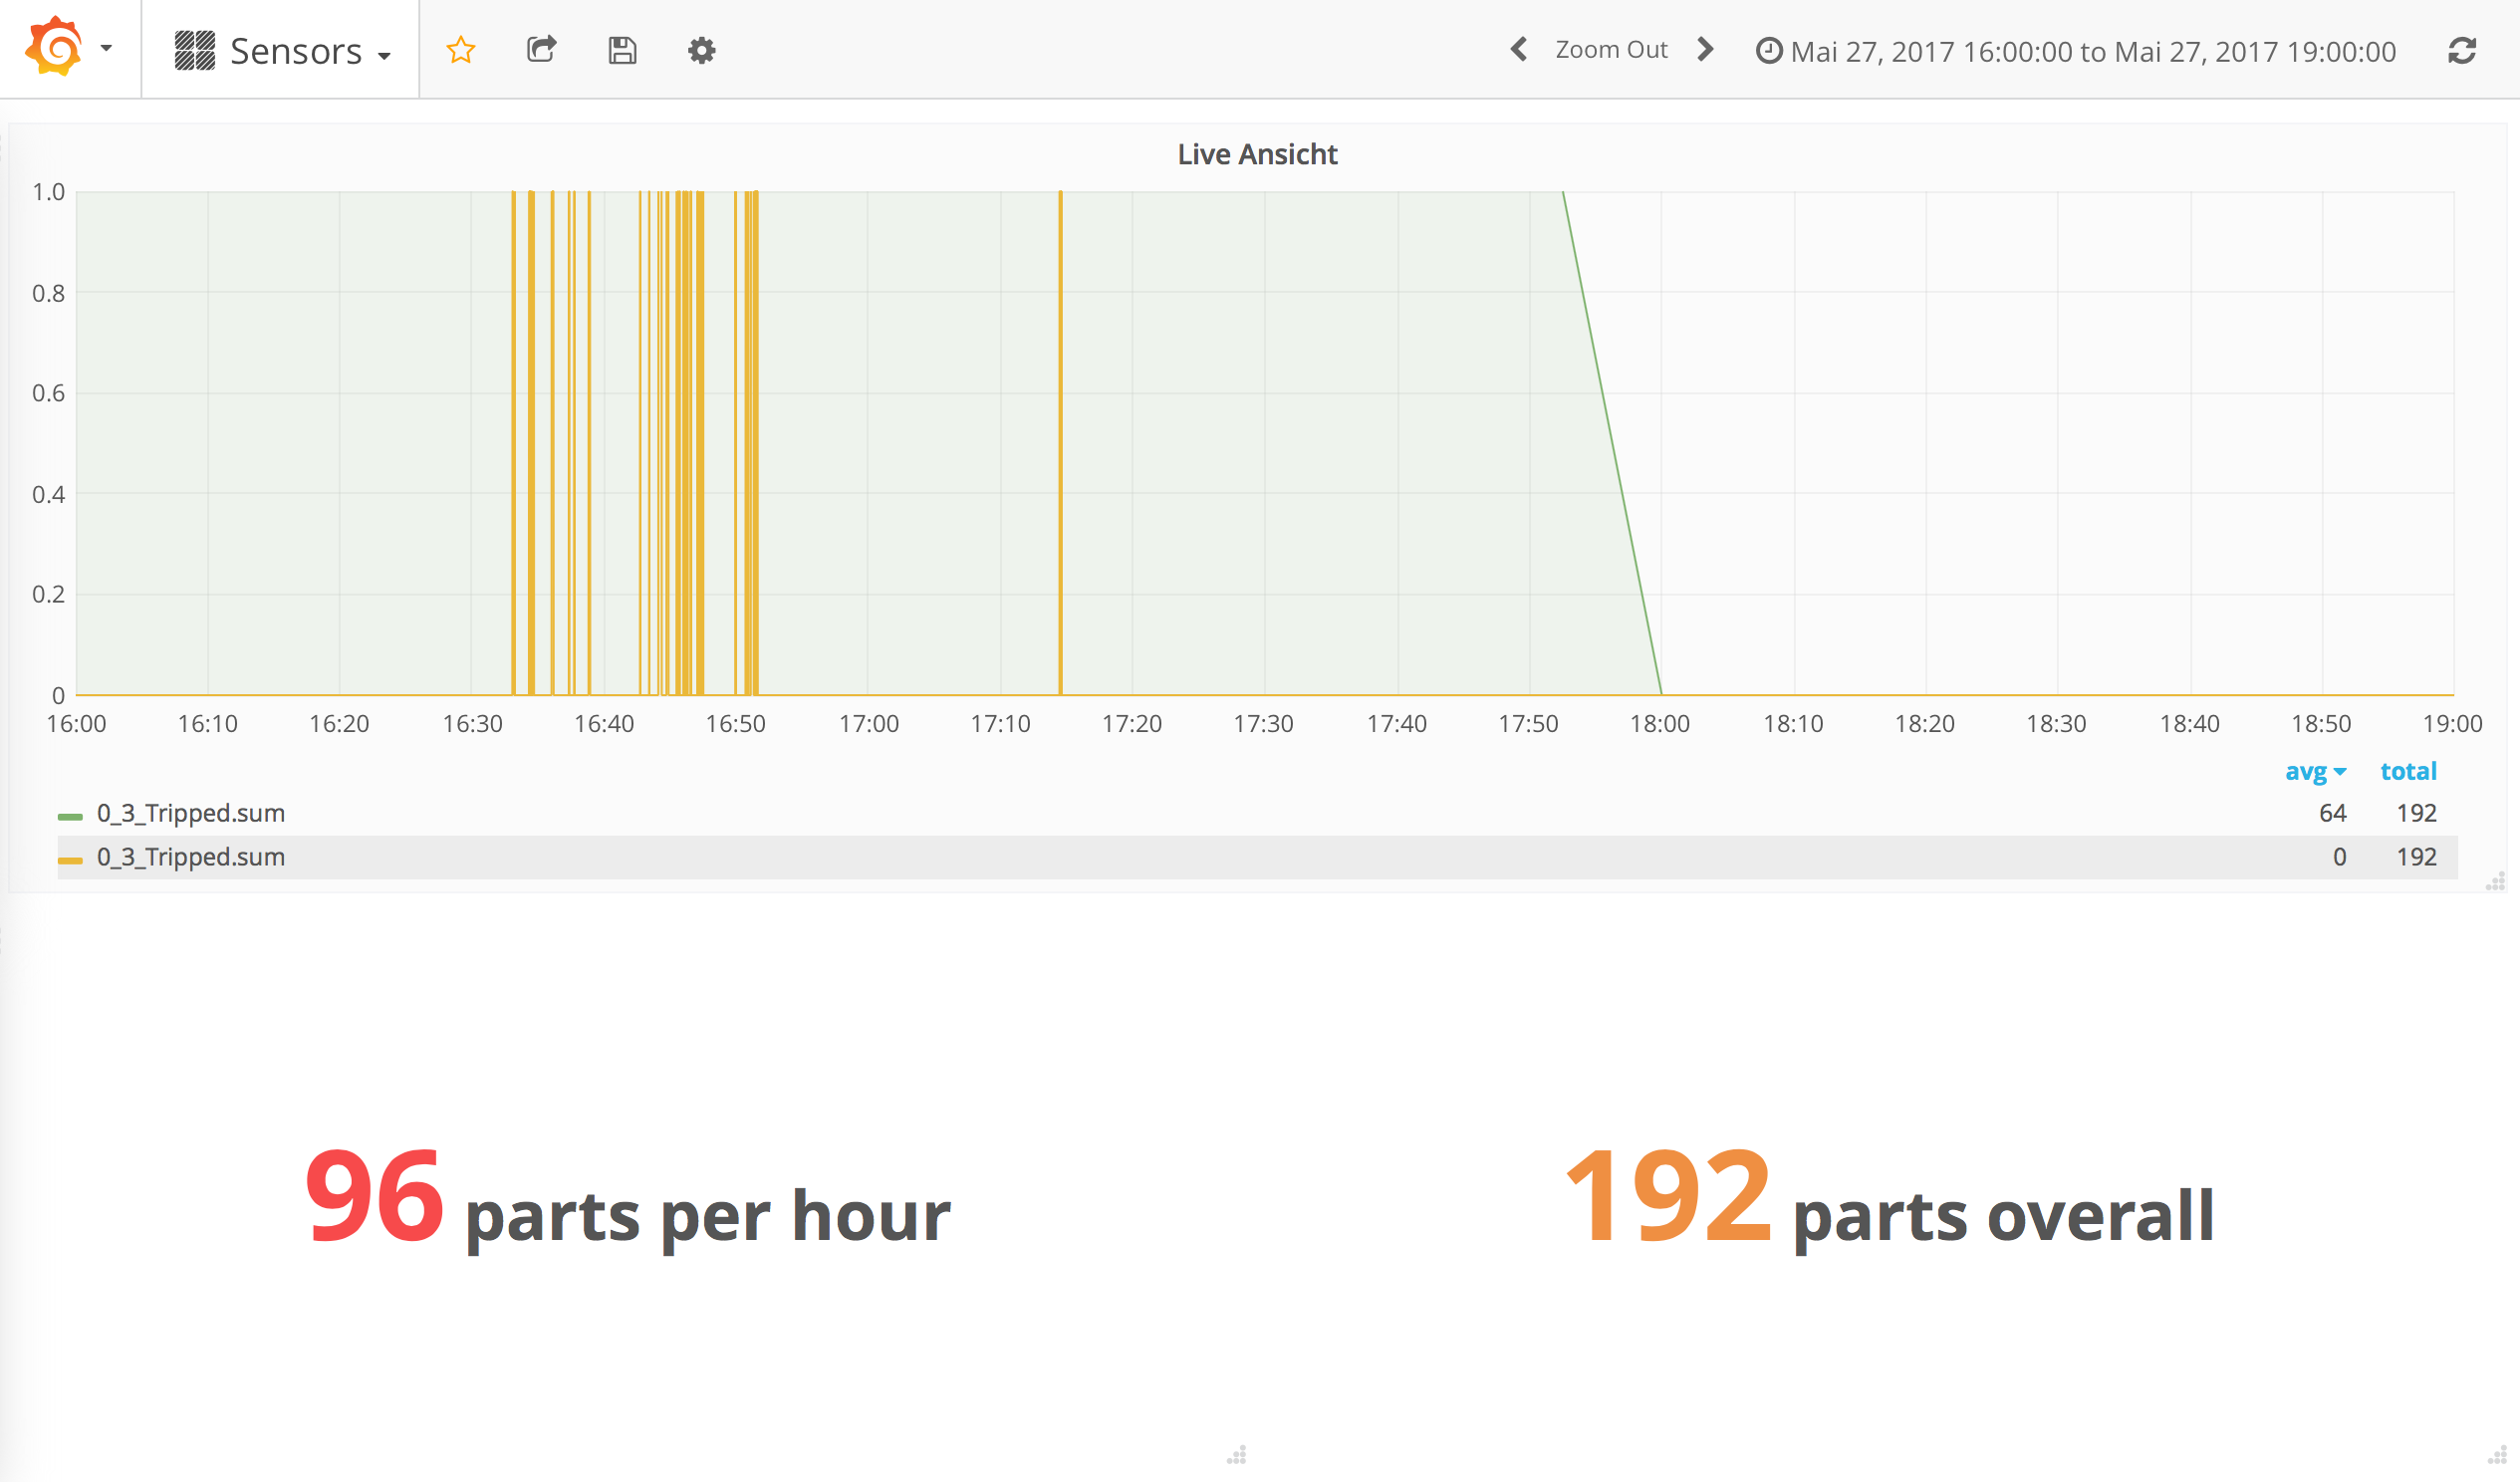
Attached you can find screenshots of the issue.
I really hope you guys can help me. I appreciate any hint! ![]()