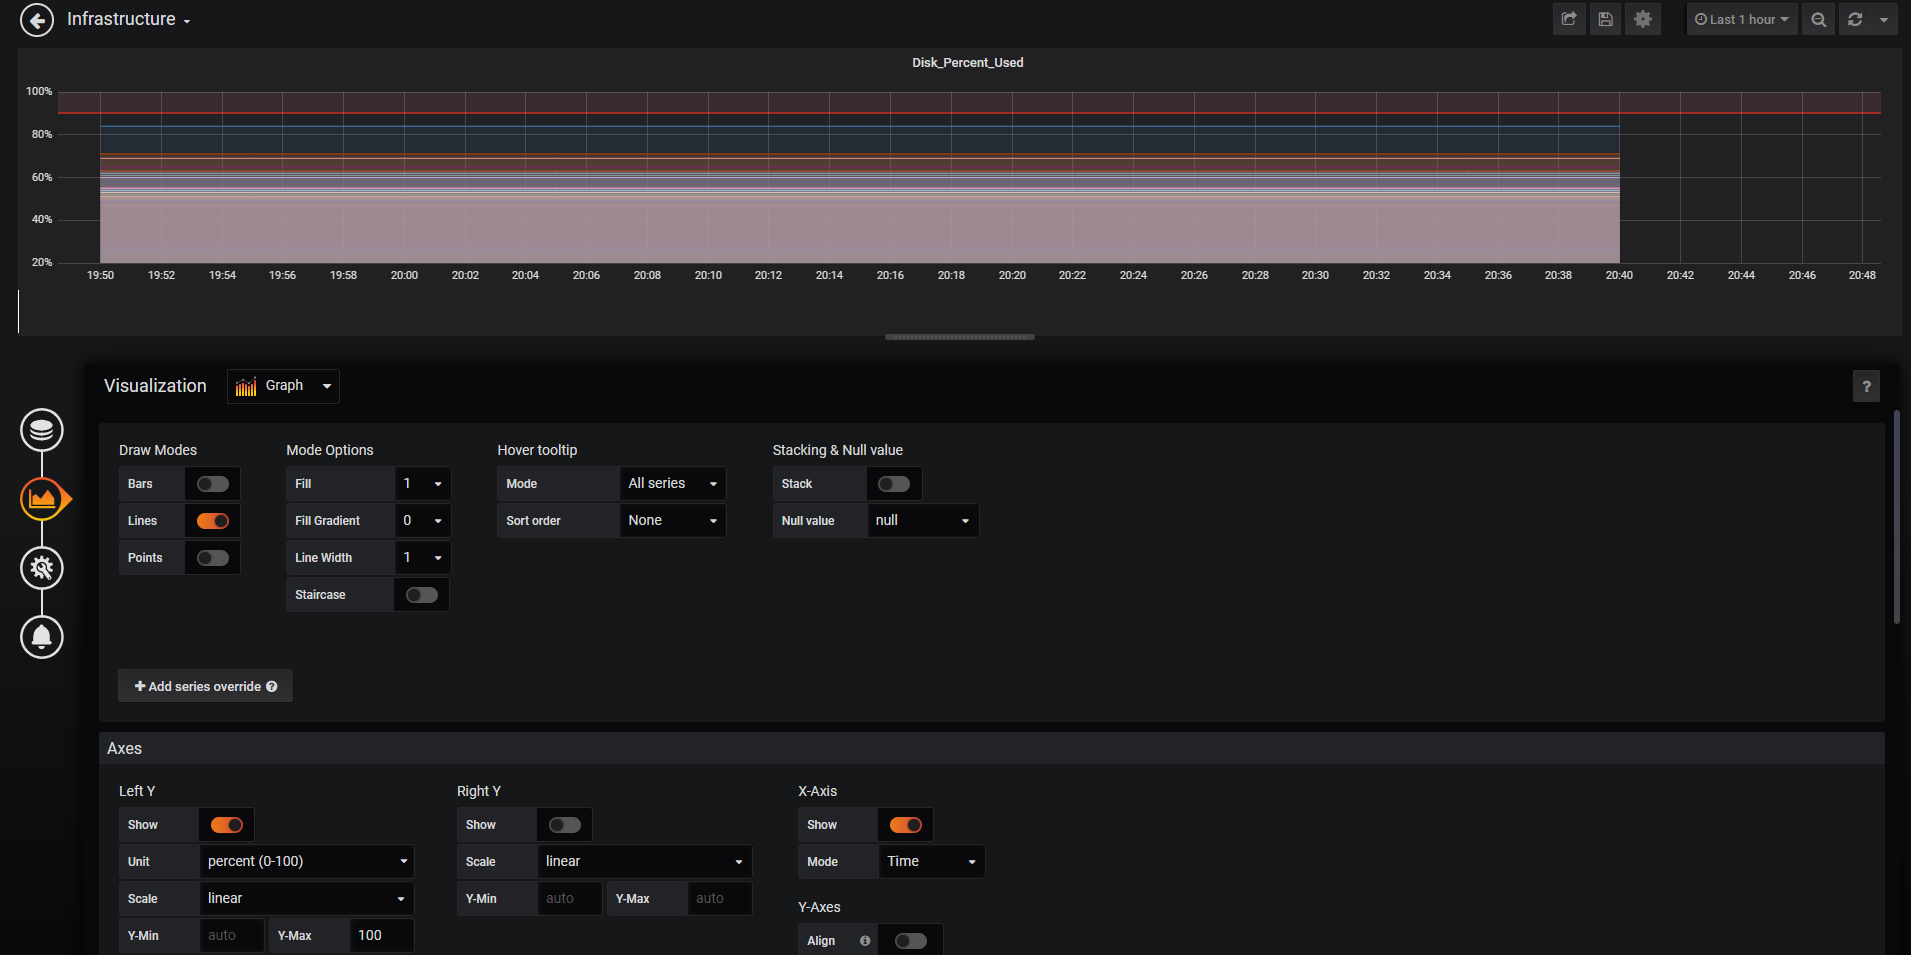
I have a graph which gets data every 5 minutes. However, Grafana is showing every minute as seen in the screenshot below.
Can I either:
Only show every 5 minute time stamps?
Extend the data based of the last data point to the end of the chart?
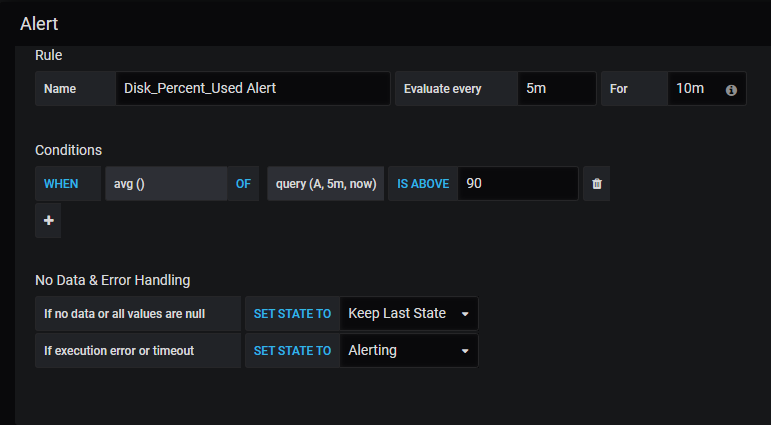
I have a alert configured for this graph also, and the alert is showing “No Data” and I am guessing this is why.
Fill the field like this in the query…
Regards,
I tried setting the “min time interval” which still shows the same issue when looking at a closer time interval.
3 Hour View
1 Hour View
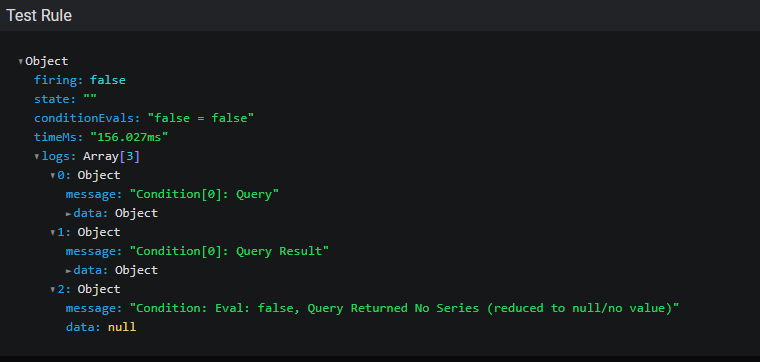
Also for the alert I am getting this:
Please send the sample of the documents, Just want to make sure the timestamp…
Please send the sample of the documents, Just want to make sure the timestamp…
I’m not sure what you are asking for? Do you have a example?
yes, example of the document, just for different timestamp and few fields…
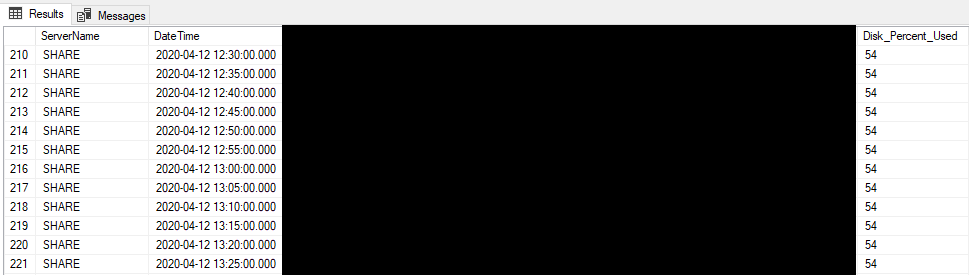
Here is a sample of the data
Try this…
I have this right now. Also selecting the “stack” value combines the charts so I can’t use that. It also does not change the time issue.
The time data should extend to the very edge of the chart using the last received data point.
Try to make the refresh automatically for 10s at the upper right…
Did you use elasticsearch as Datasource?@timestamp and DateTime from your data…
Regards,
Data Source is SQL database.
Keep in mind, the data (as shown in the prior screenshot), is only for every 5 minutes.
It’s strange for me…
It’s strange for me…
Not sure what you are trying to say. Your English is a bit off. Do you have a example screenshot of this working then?
Here is the GitHub link for this issue:
opened 05:58AM - 14 Apr 20 UTC
closed 06:09AM - 14 Apr 20 UTC
needs more info
<!--
Please use this template while reporting a bug and provide as much info as… possible.
Questions should be posted to https://community.grafana.com
Use query inspector to troubleshoot issues: https://community.grafana.com/t/using-grafanas-query-inspector-to-troubleshoot-issues/2630
-->
**What happened**:
Data is stored in a SQL database, and that data is sent every 5 minutes.
**What you expected to happen**:
The last data point shown on the graph would be extended for each minute until a new data point is present.

**How to reproduce it (as minimally and precisely as possible)**:
Setup a graph with time data every 5 minutes instead of every minute.
**Anything else we need to know?**:
View this forum thread about the issue for screenshots.
https://community.grafana.com/t/visualization-display-every-5-minutes/28476
**Environment**:
- Grafana version: Grafana v6.3.3 (84d0a71)
- Data source type & version: SQL DB
- OS Grafana is installed on: Windows Server
- User OS & Browser: Chrome
- Grafana plugins: None
- Others: None