V8 and Y-Axis zero align

I’m using Timeseries graphs on Grafana v8.0.2 (5c5d45e19f) with 2 different queries using right and left Y-Axes.

one of the queries can generate positive and negative values and the other only generates positive ones. i’d like the zero on both axes aligned.

in older versions there used to be a checkbox to zero align the two axes but i can’t figure out how to do that in the new Timeseries graph.

1 Like

hi @popmonkey

I’d like to try and help you figure this out. Can you share your panel json so I can fiddle with it?

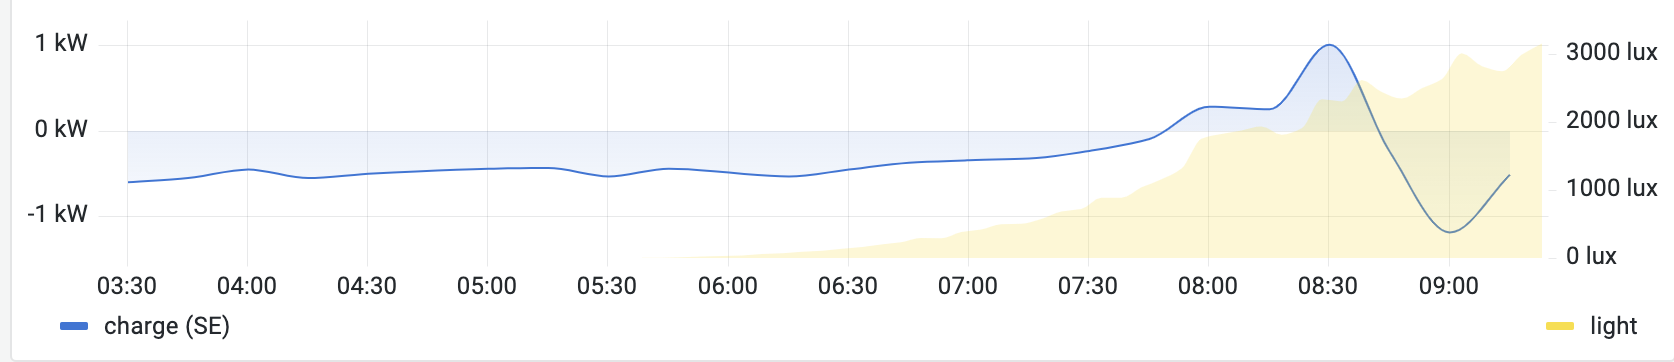
thanks Matt, there’s two sets of data, kW on the left, Lux on the right. kW can be negative as it represents charge/discharge.

here’s the panel json

{
  "id": 4,
  "gridPos": {
    "h": 13,
    "w": 12,
    "x": 0,
    "y": 13
  },
  "type": "timeseries",
  "title": "Charge vs Light",
  "datasource": "InfluxDB (db)",
  "fieldConfig": {
    "defaults": {
      "custom": {
        "drawStyle": "line",
        "lineInterpolation": "smooth",
        "barAlignment": 0,
        "lineWidth": 3,
        "fillOpacity": 20,
        "gradientMode": "opacity",
        "spanNulls": false,
        "showPoints": "never",
        "pointSize": 5,
        "stacking": {
          "mode": "none",
          "group": "A"
        },
        "axisPlacement": "auto",
        "axisLabel": "",
        "scaleDistribution": {
          "type": "linear"
        },
        "hideFrom": {
          "tooltip": false,
          "viz": false,
          "legend": false
        },
        "thresholdsStyle": {
          "mode": "off"
        }
      },
      "color": {
        "mode": "palette-classic"
      },
      "thresholds": {
        "mode": "absolute",
        "steps": [
          {
            "color": "green",
            "value": null
          },
          {
            "color": "red",
            "value": 80
          }
        ]
      },
      "mappings": [],
      "noValue": "_",
      "unit": "kwatt"
    },
    "overrides": [
      {
        "matcher": {
          "id": "byName",
          "options": "kW value {domain=\"sensor\", entity_id=\"solaredge_storage_power\"}"
        },
        "properties": [
          {
            "id": "displayName",
            "value": "charge (SE)"
          },
          {
            "id": "color",
            "value": {
              "fixedColor": "blue",
              "mode": "fixed"
            }
          },
          {
            "id": "custom.lineWidth",
            "value": 1
          }
        ]
      },
      {
        "matcher": {
          "id": "byFrameRefID",
          "options": "LIGHT"
        },
        "properties": [
          {
            "id": "custom.axisPlacement",
            "value": "right"
          },
          {
            "id": "unit",
            "value": "lux"
          },
          {
            "id": "custom.drawStyle",
            "value": "line"
          },
          {
            "id": "custom.lineInterpolation",
            "value": "smooth"
          },
          {
            "id": "custom.lineWidth",
            "value": 0
          },
          {
            "id": "color",
            "value": {
              "fixedColor": "light-yellow",
              "mode": "fixed"
            }
          },
          {
            "id": "custom.fillOpacity",
            "value": 24
          },
          {
            "id": "custom.gradientMode",
            "value": "none"
          }
        ]
      },
      {
        "matcher": {
          "id": "byName",
          "options": "lx value {domain=\"sensor\", entity_id=\"front_entry_motion_sensor_light_level\"}"
        },
        "properties": [
          {
            "id": "displayName",
            "value": "light"
          }
        ]
      }
    ]
  },
  "options": {
    "tooltip": {
      "mode": "multi"
    },
    "legend": {
      "displayMode": "list",
      "placement": "bottom",
      "calcs": []
    }
  },
  "targets": [
    {
      "query": "from(bucket: \"test\")\n  |> range(start: v.timeRangeStart, stop: v.timeRangeStop)\n  |> filter(fn: (r) => r[\"entity_id\"] == \"solaredge_storage_power\")\n  |> filter(fn: (r) => r[\"_field\"] == \"value\")\n  |> filter(fn: (r) => r[\"_measurement\"] == \"kW\")\n  |> map(fn: (r) => ({\n    r with _value:\n      if r[\"entity_id\"] == \"solaredge_storage_power\" then\n        r._value * -1.0\n      else\n        r._value\n  }))\n  |> aggregateWindow(every: v.windowPeriod, fn: mean, createEmpty: false)\n  |> yield(name: \"mean\")",
      "queryType": "randomWalk",
      "refId": "SOLAREDGE"
    },
    {
      "hide": false,
      "query": "from(bucket: \"test\")\n  |> range(start: v.timeRangeStart, stop: v.timeRangeStop)\n  |> filter(fn: (r) => r[\"entity_id\"] == \"front_entry_motion_sensor_light_level\")\n  |> filter(fn: (r) => r[\"_field\"] == \"value\")\n  |> aggregateWindow(every: v.windowPeriod, fn: mean, createEmpty: false)\n  |> yield(name: \"mean\")",
      "refId": "LIGHT"
    }
  ],
  "description": ""
}

hmmm, this is looking tough. I’ve asked the frontend squad if there is an equivalent with in Grafana 8. I’m wondering if the ability to add more that 2 axes (which is a large enhancement) came at the cost of a zero-align button…I’ll let you know what I hear
~m

1 Like

thanks for checking.

it would seem tho that once you can have 2 axes it should be the same process to add a 3rd or more. having multiple unit graphs on the same panel is super useful for relative comparisons so zero align is key.

yep, I hear you on all that. For now, I think the only workaround is to set the width manually for each axis. Not ideal but you can get the values roughly aligned…

Will let you know if I hear more on this! Might be a valuable feature request…

could you elaborate a little? what do you mean by adjusting the width? do you mean specifying min and max values?

that’s a decent workaround actually even tho it looks terrible most of the time :wink:

Yeah, that’s basically what I meant–fiddling with the min and max for each axis independently until they align, more or less. I agree that it is not nearly as graceful or as pleasant a UX as the zero-align toggle…

I think this would make a good enhancement request…

It becomes recurrently annoying that features present in <V8 have just been removed in V8, and that nobody seems to care about this. Using the old plot is a temporary option, but we expect that these features are priorised in V8 before implementing other nice to have things…

Same thing for the 2nd y-axis having the same units than the first, this has still not been fixed since months and is only possible with workarounds…

1 Like

Any news on this topic? Is anyone caring?

2 Likes

@enrikre here are some bug reports and feature requests in the repo. Let us know if anything looks missing :+1:

I know this is as an old topic, but I can’t find an answer elsewhere - did the regression (I think it probably is) get sorted? I can’t find an equivalent axis alignment setting in V8
thanks

2 Likes

sadly no. i don’t think it’s even considered a bug. v8 seems to be a complete rewrite and new feature set and not every feature was reproduced :frowning:

2 Likes

The ability to zero align dual axes is pretty important.

1 Like

I would hop on this thread on this epic issue in GH. It is the definitive place where we are tracking feature parity between Graph (old) and Time series panels.

this is useful information

This topic was automatically closed after 365 days. New replies are no longer allowed.

There’s a fix here!

1 Like