tjw74
July 8, 2021, 9:55pm
1
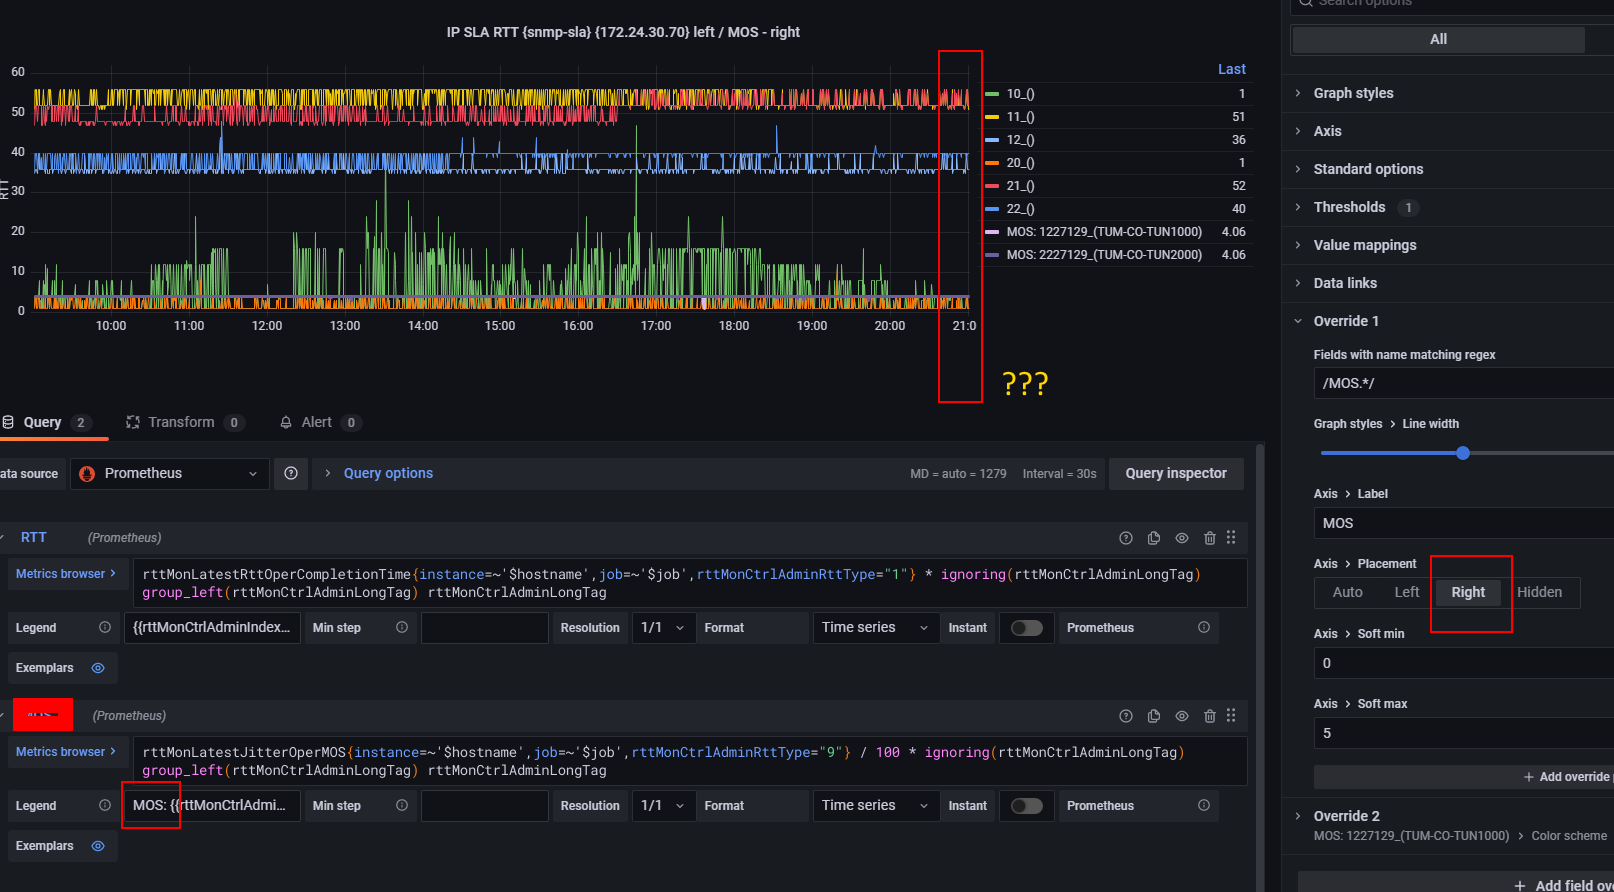
Two time series metrics, value and timestamp for each. Both units are dollars. Placement left and placement right.
When both units are set to dollars it puts them both on the left Axis. I want one on the right and one of the left, only works if one of them is NOT unit dollars.
Bug? or am I doing it wrong?
Hi @tjw74
You are not doing this wrong. This is an ongoing issue and very much on the squad’s radar. Check out these issues for a larger discussion and some workarounds:
opened 02:03PM - 19 Mar 21 UTC
area/field/overrides
type/feature-request
In the Graph panel, it's possible to set the left- and right-y axis to be the sa… me unit. This is useful to compare two series with the same unit but different scales. In the new time-series panel, there seems to be no way to put a series on the opposite axis if it has the same unit.
opened 04:56PM - 30 Jun 21 UTC
area/frontend
area/panel/timeseries


**Environment**:
- Grafana version: 8.0.3
- Data source type & version: Prometheus
- OS Grafana is installed on: Linux debian 10 (buster) x64
- User OS & Browser: Windows 10, Chrome
- Grafana plugins:
- Others:
tjw74
July 17, 2021, 12:33am
3
Thanks, appreciate the reply. I read through those threads. They are over complicating it and it’s still broke.
Just make a switch that says each metric has it’s own Y axis…and you should be able to resize and move your axis by dragging.
Just like ploty allows.
1 Like
